
A different way to present your research, make a cake that is an abstract of your paper or thesis. These are the cakes from our group.
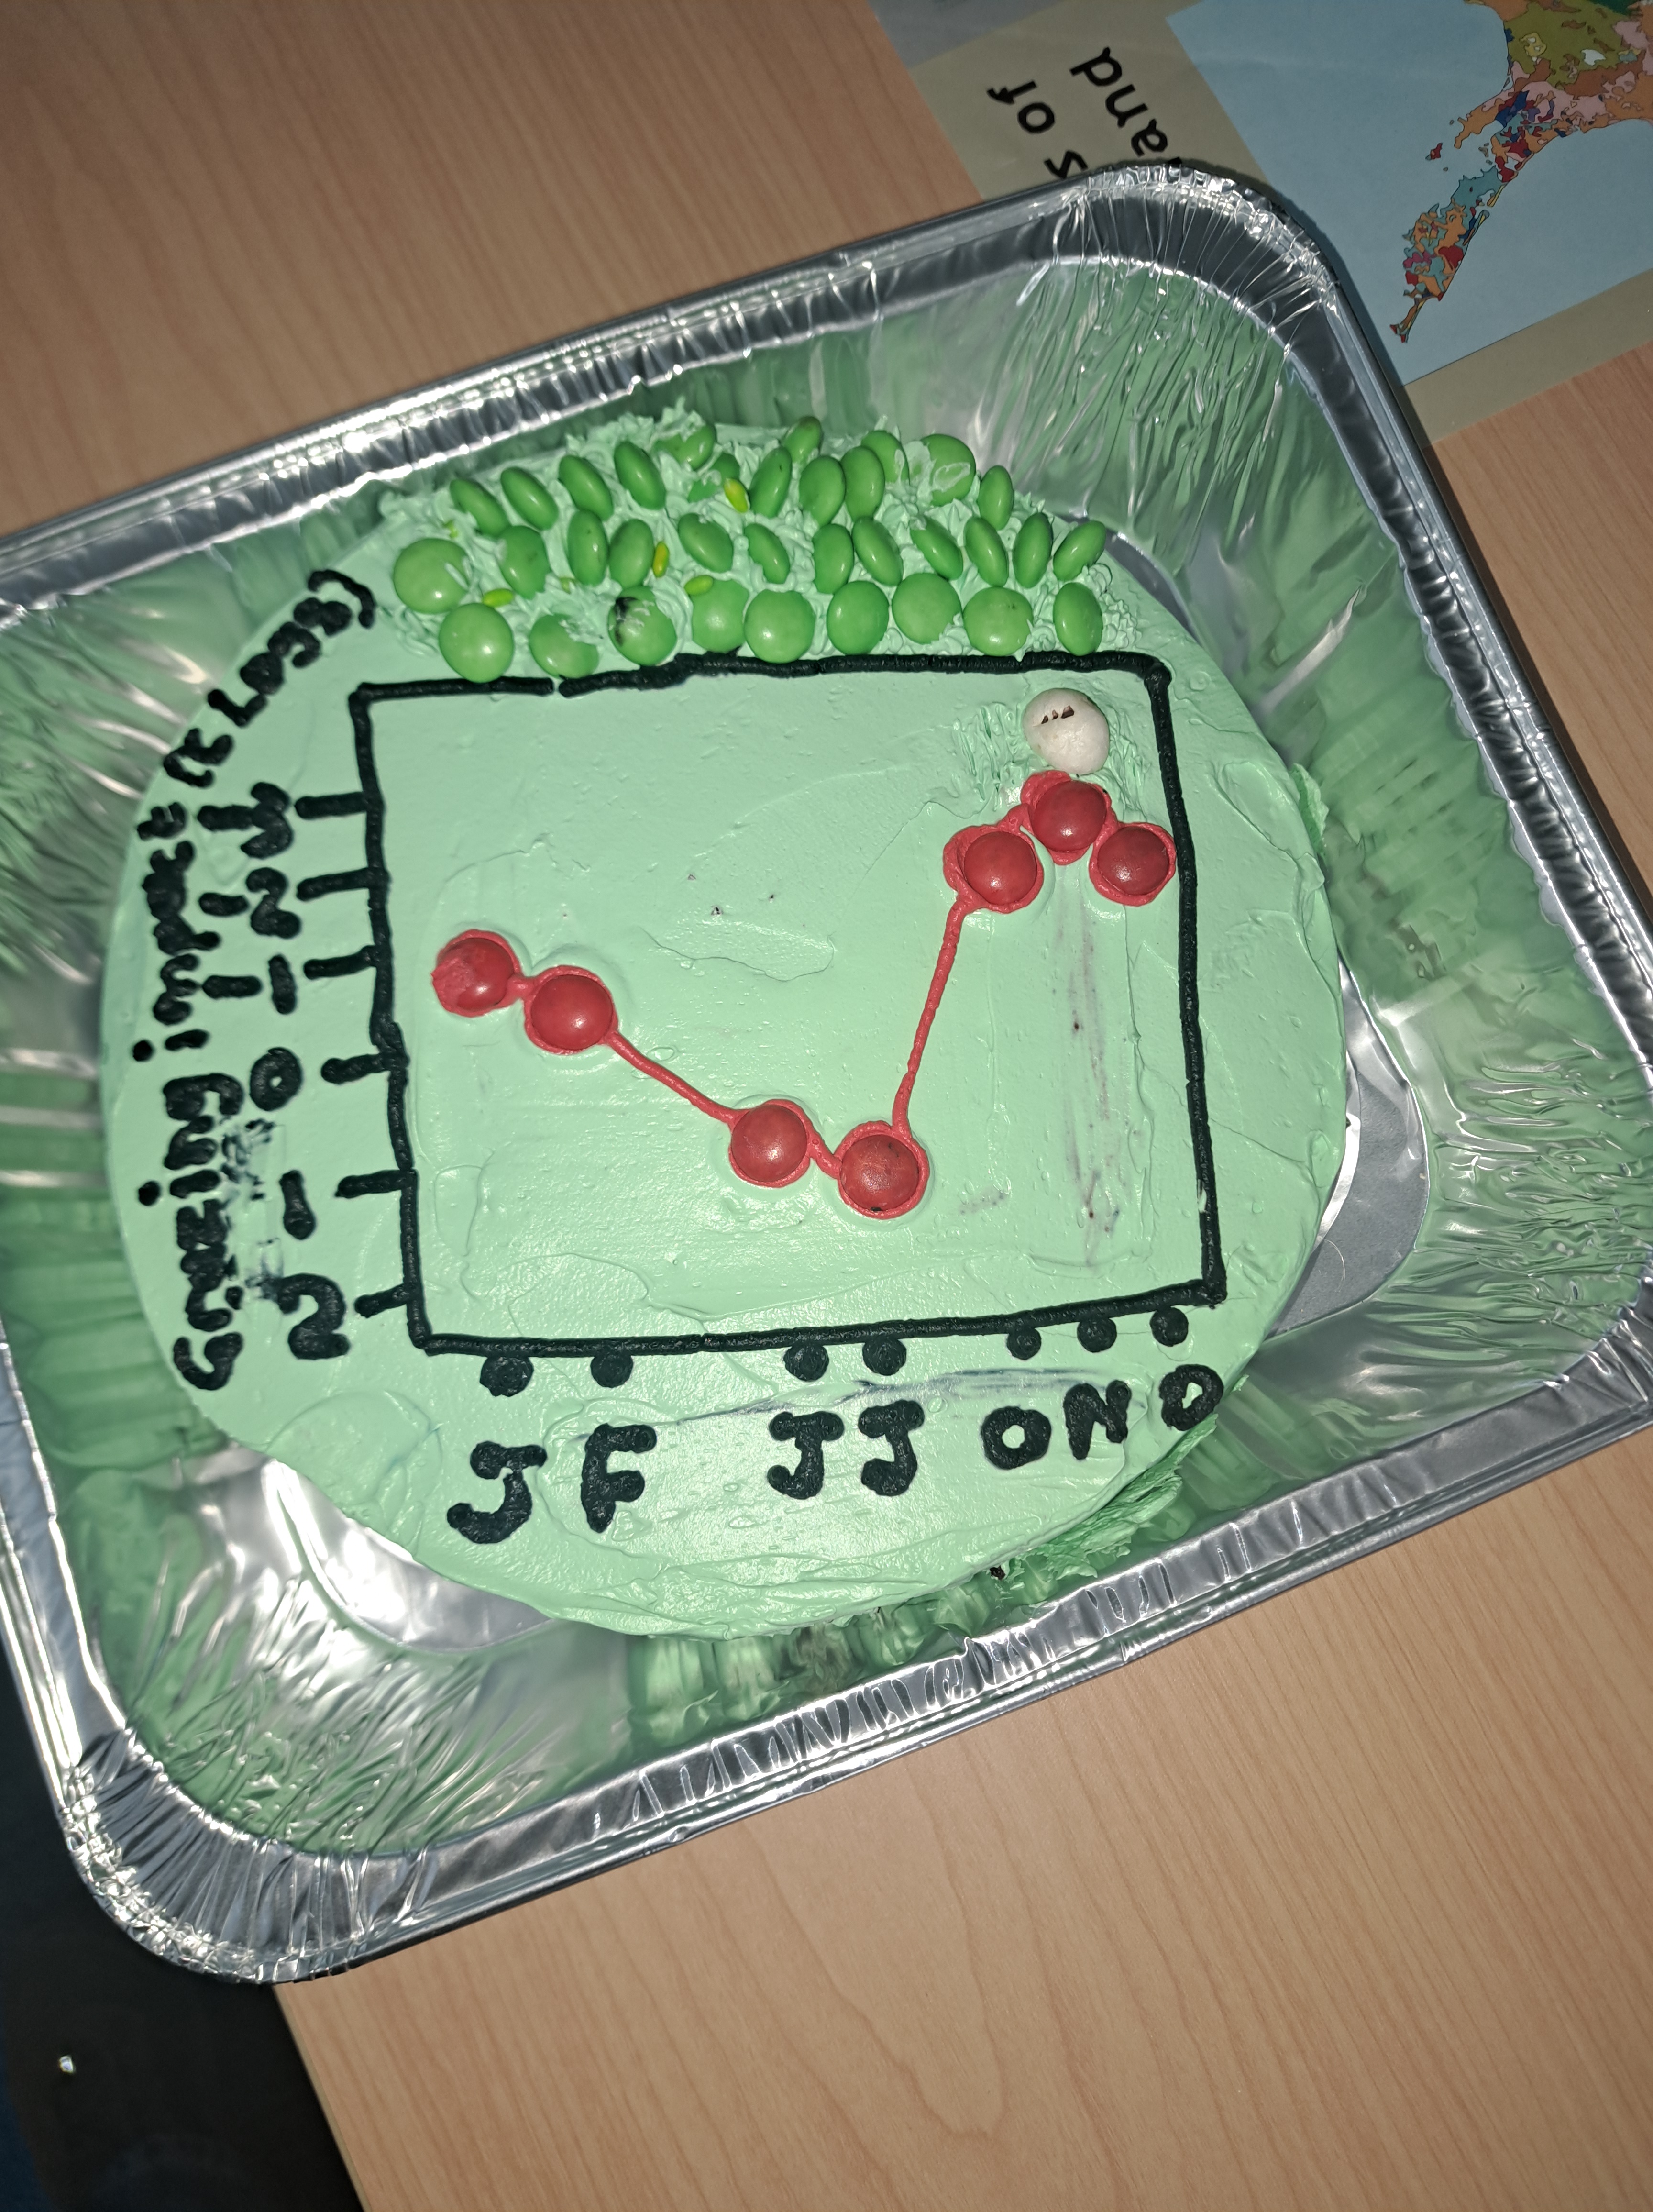
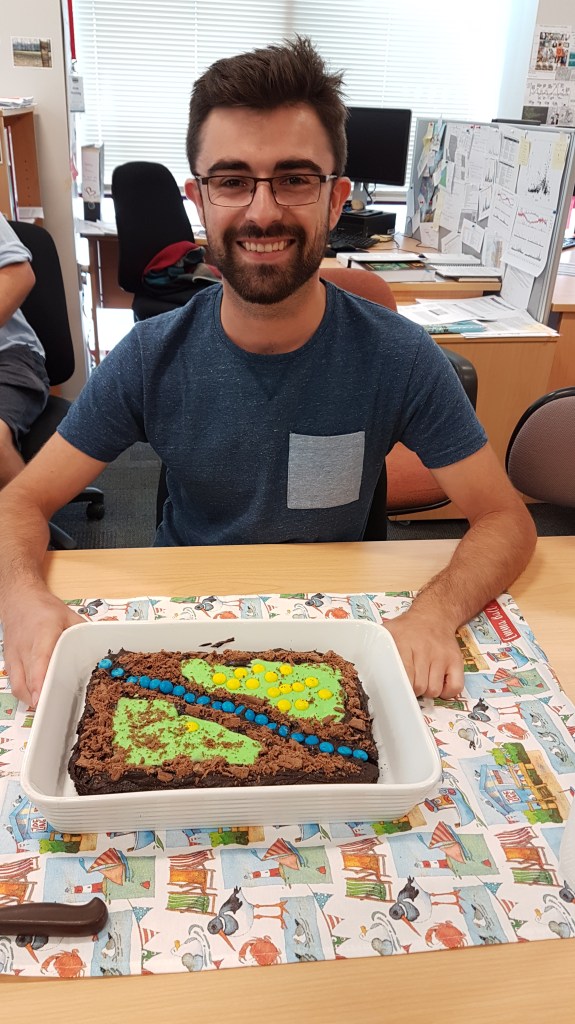
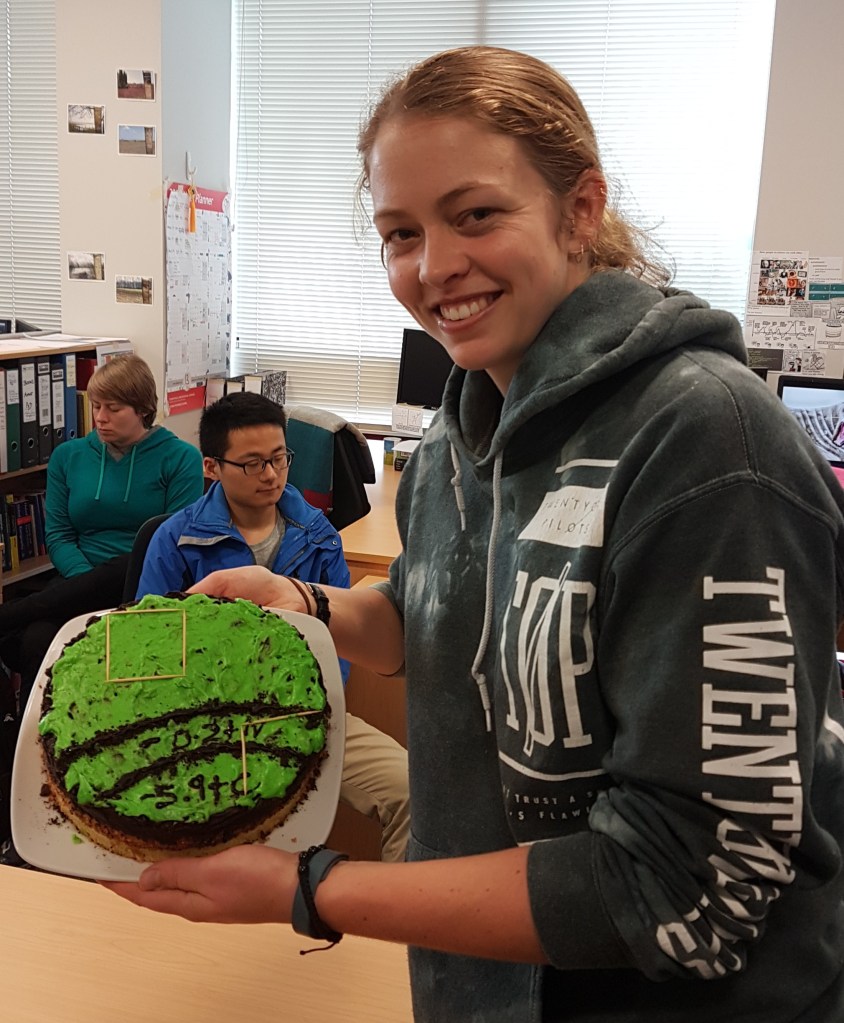
Grazing timing and carbon capture
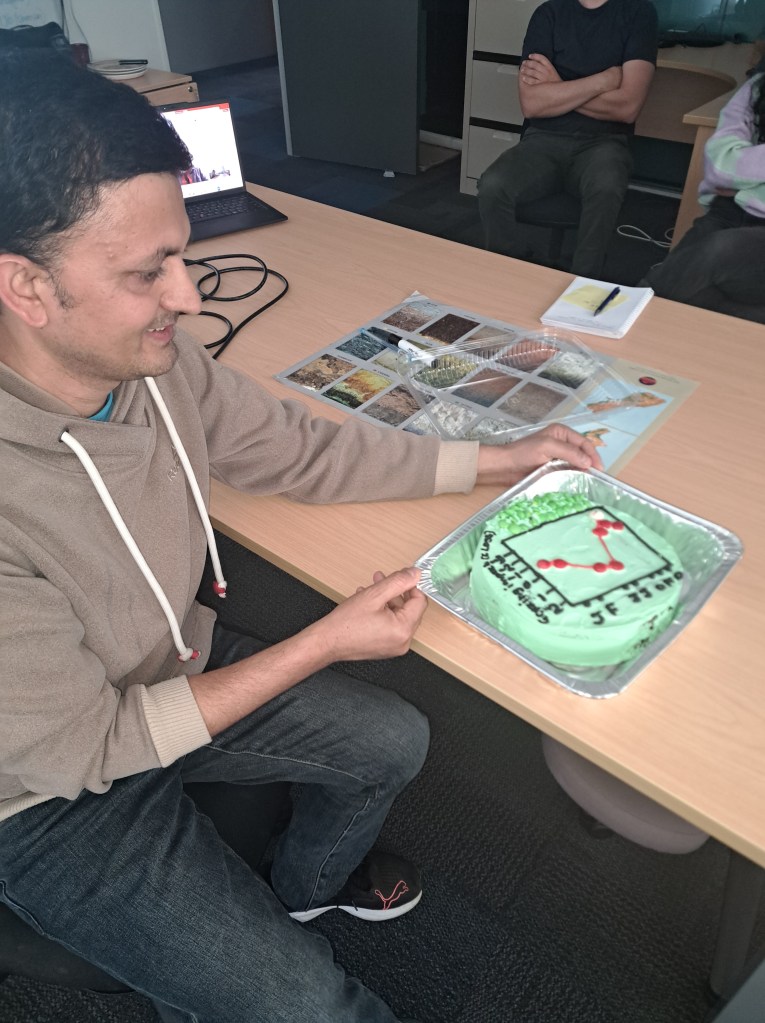
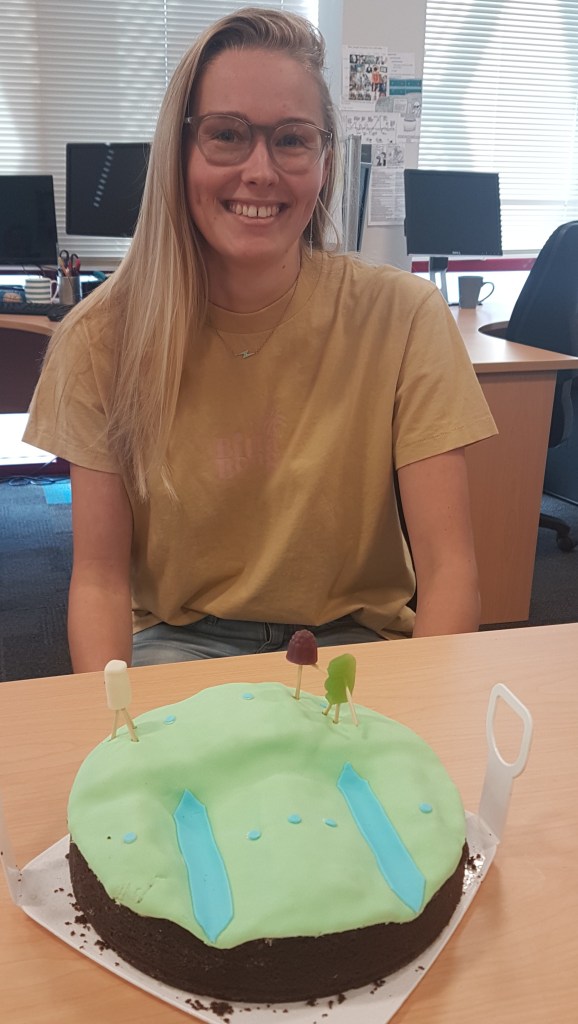
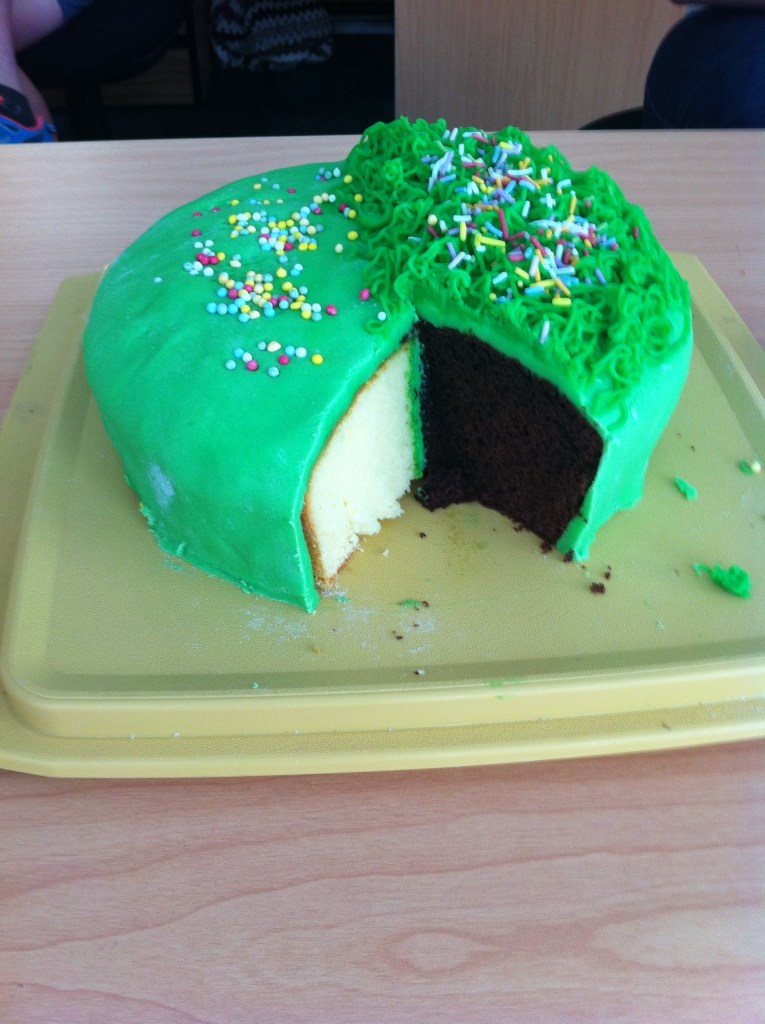
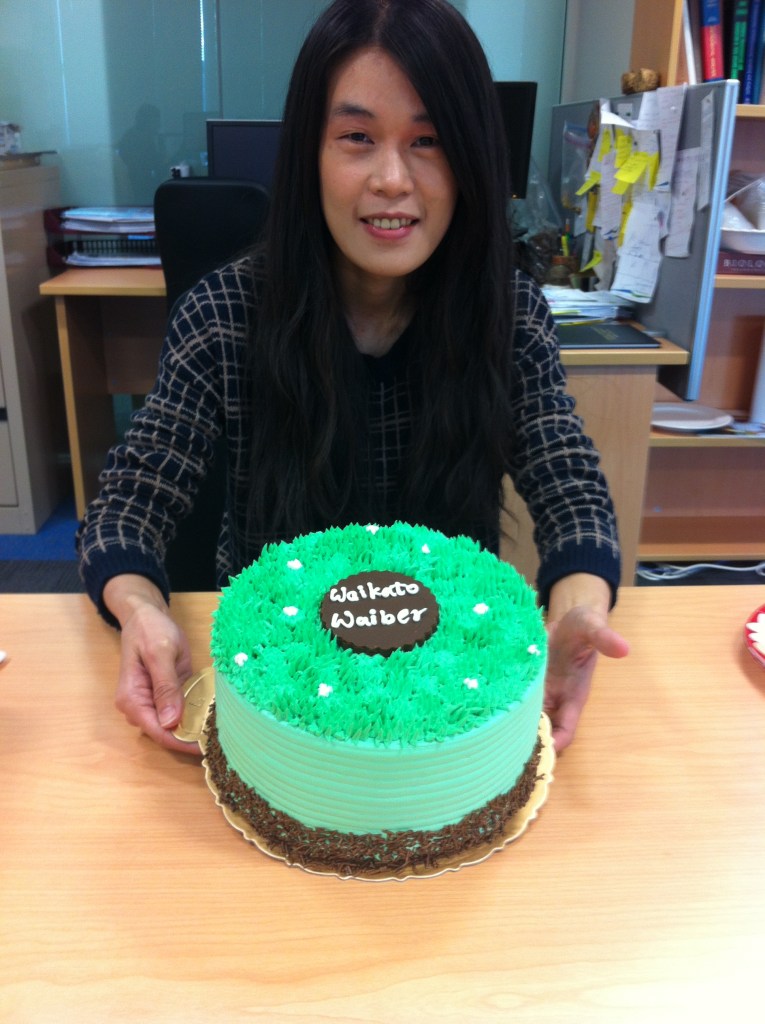
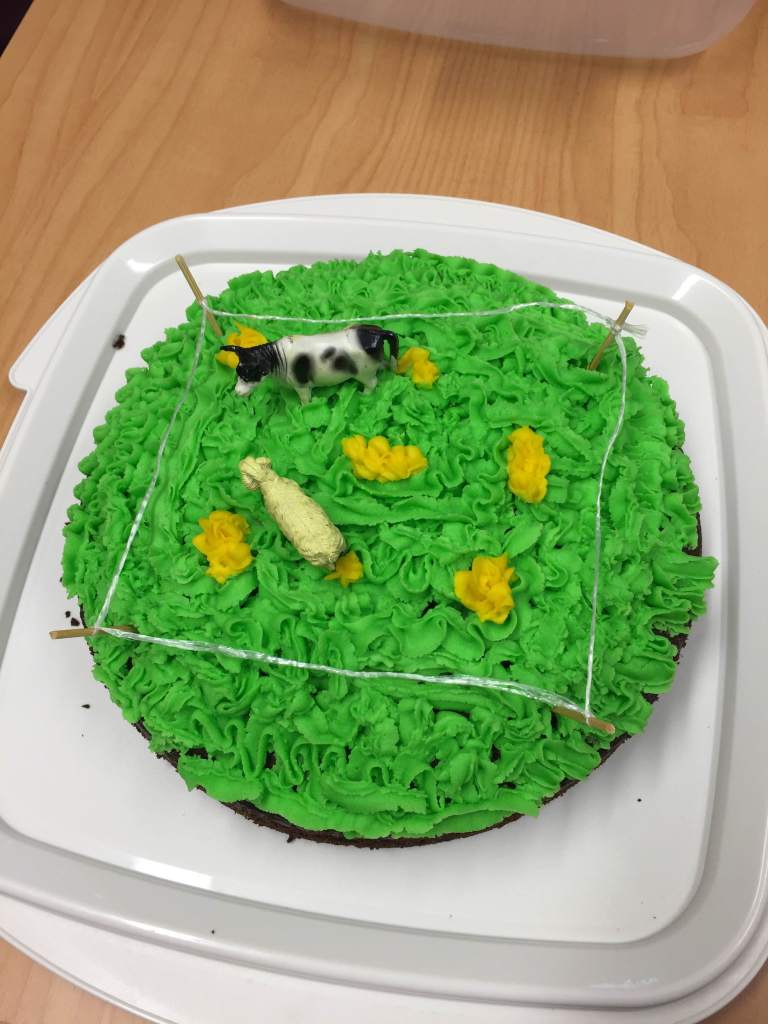
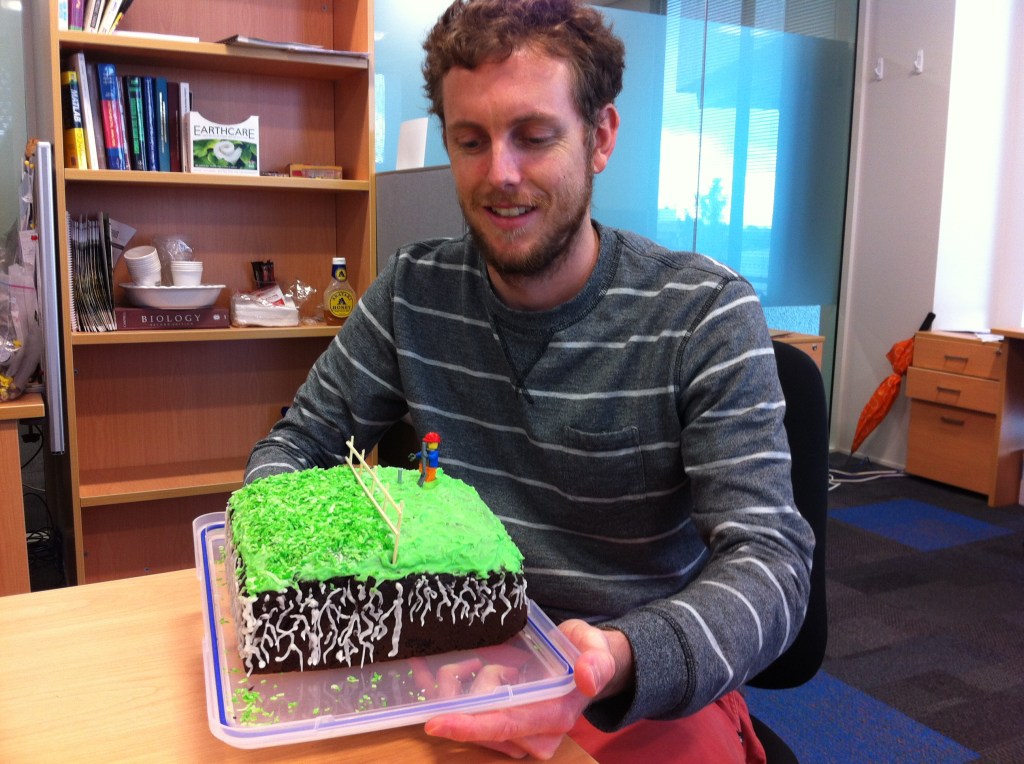
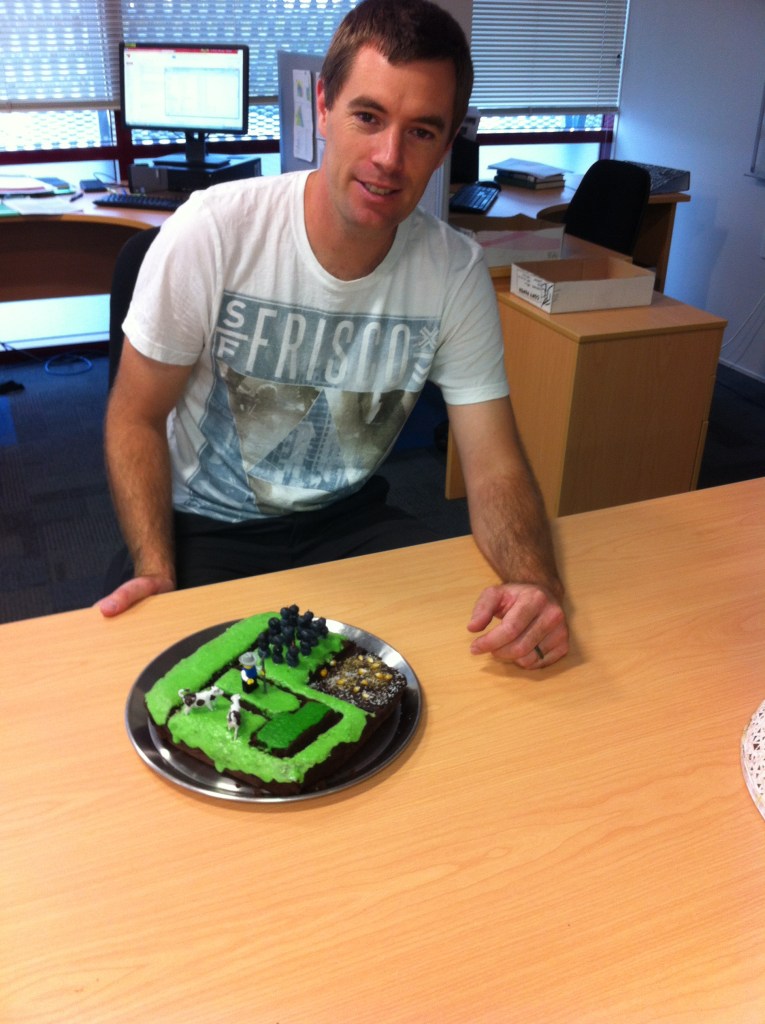
This research cake represents part of Mohan’s PhD project examining the impacts of grazing on CO₂ exchange in temperate pastures. The green cake surface illustrates a typical New Zealand dairy pasture, symbolizing grass cover throughout the year. A white shape inside the graph represents cows grazing year-round under a rotational grazing system, while green dots at the top indicate the amount of biomass available for grazing in managed pastures. The graph shows how the timing of grazing influences CO₂ uptake. The y-axis reflects carbon loss due to grazing, while the x-axis shows months of the year. October to December are critical months for optimizing carbon uptake in pastures, combining high photosynthetic activity with a high likelihood of belowground allocation.
You can find recently published paper here. https://authors.elsevier.com/sd/article/S0167-8809(25)00584-5
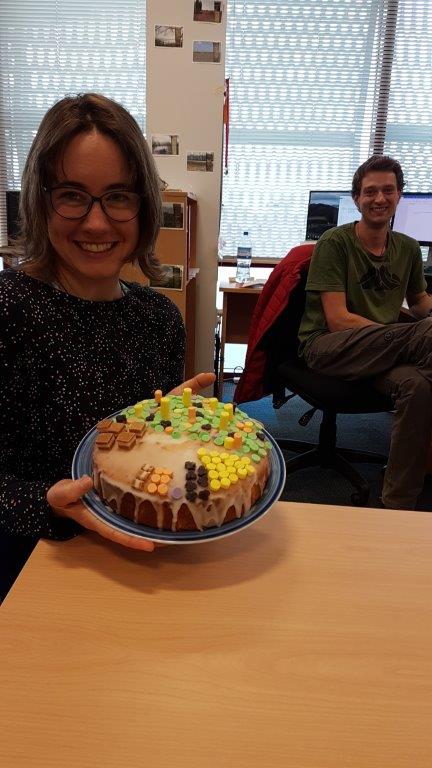
Rock weathering and peat water dynamics
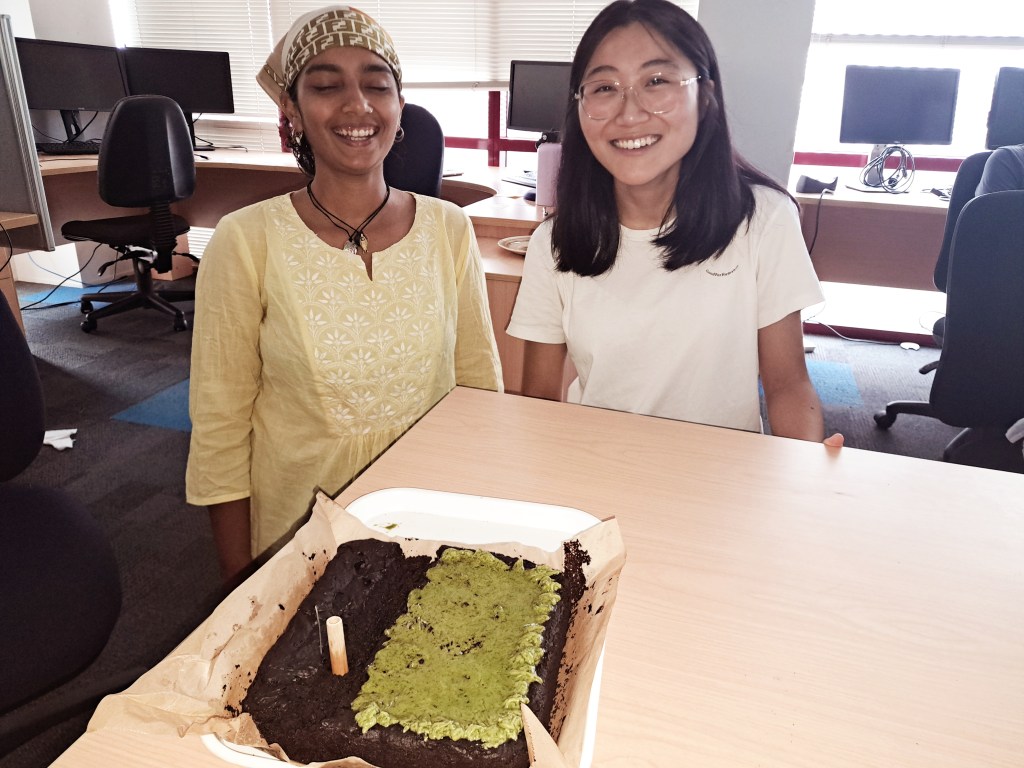
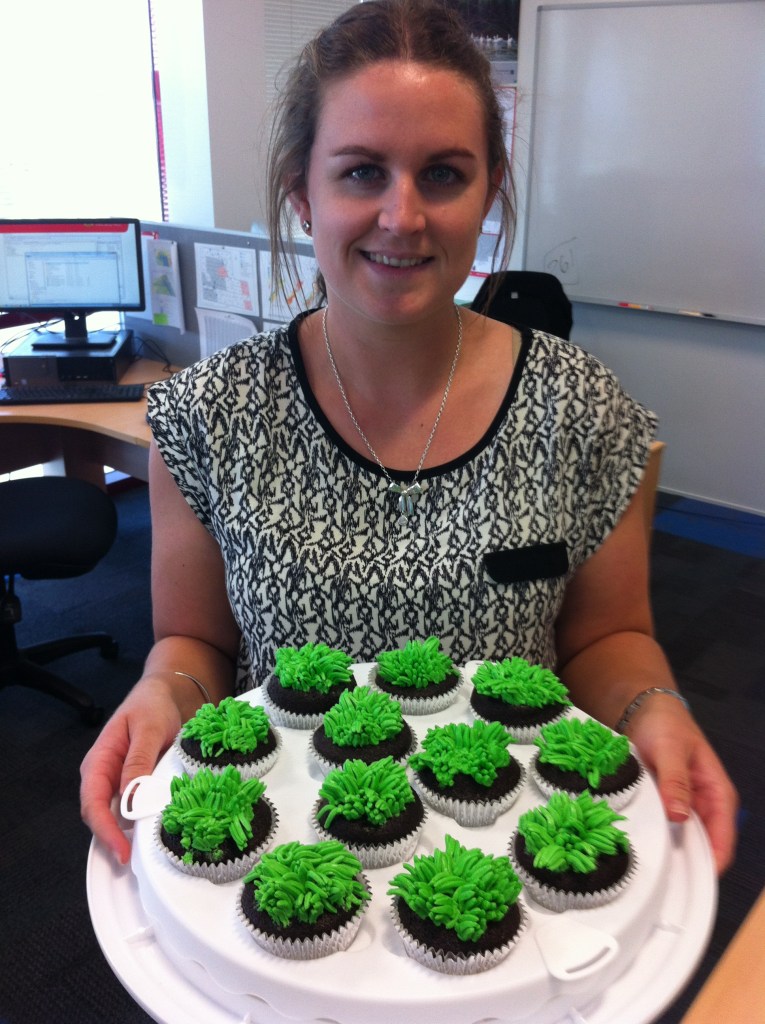
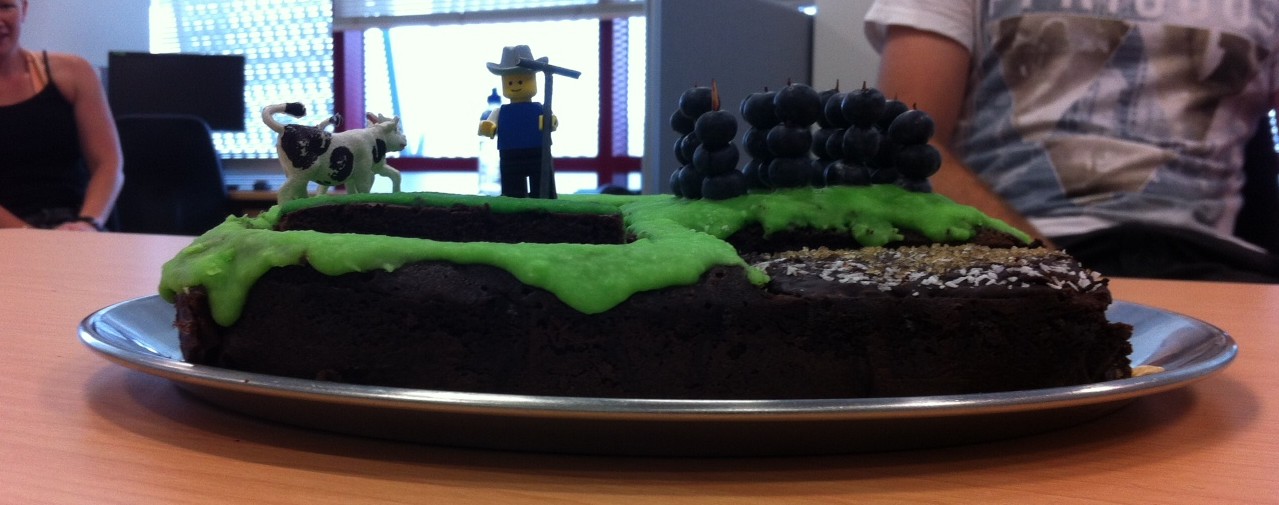
Kelly and Raah, two summer students, with their final assignment – research cake. Raah worked on determining water depths in 1st/2nd/3rd order drains in peat that will allow us to determine where we might be able to raise water tables. Her work is depicted on the left with a piezometer along side measurement of peat surface oscillation. Kelly worked on the temperature dependence of enhanced rock weathering (dunite) represented by the greenish icing on the right – delicious vegan cake!
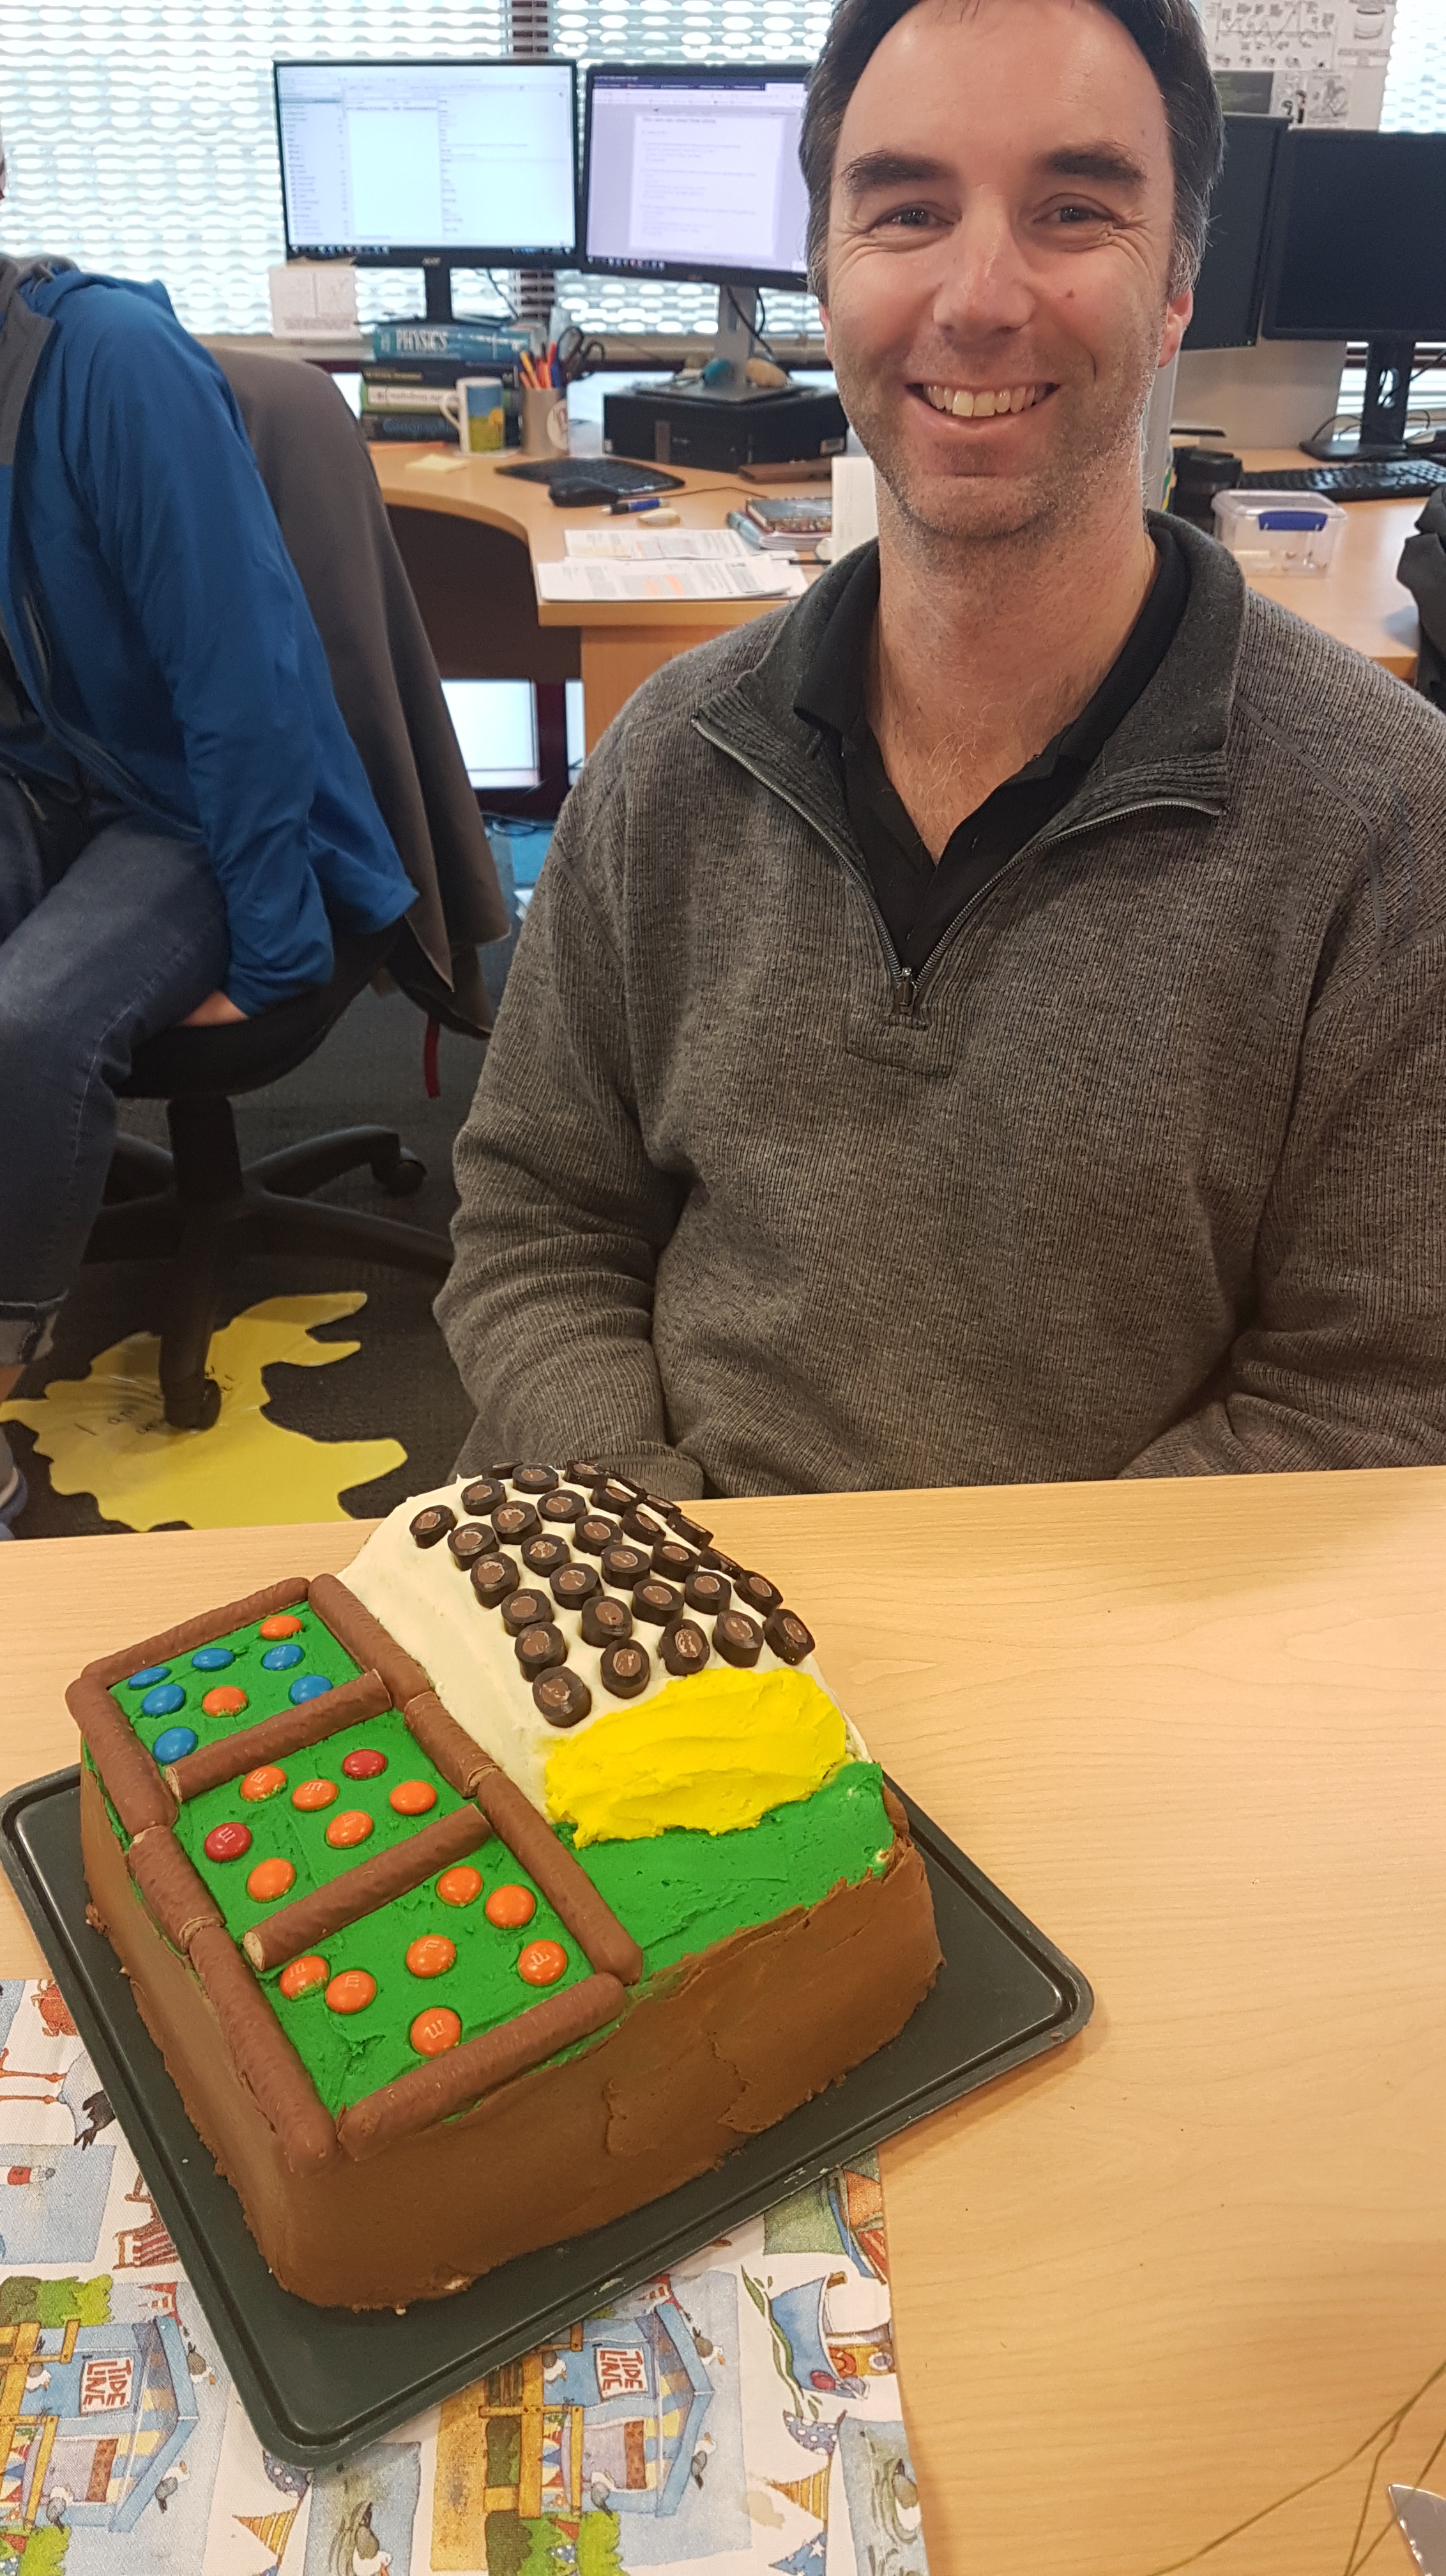
Trade-offs in grazed pastures
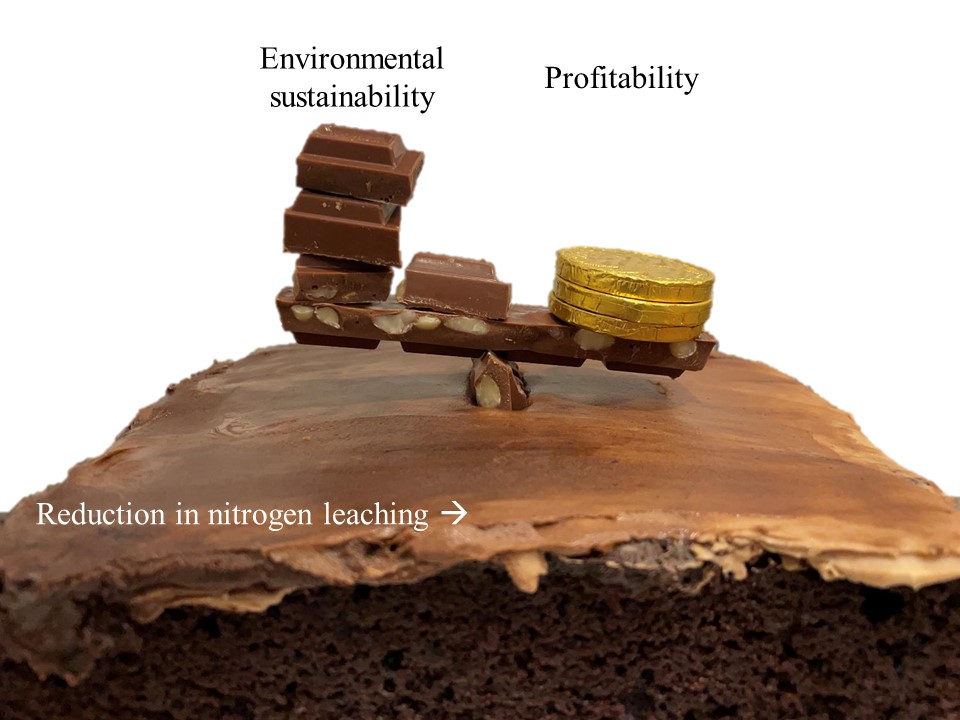
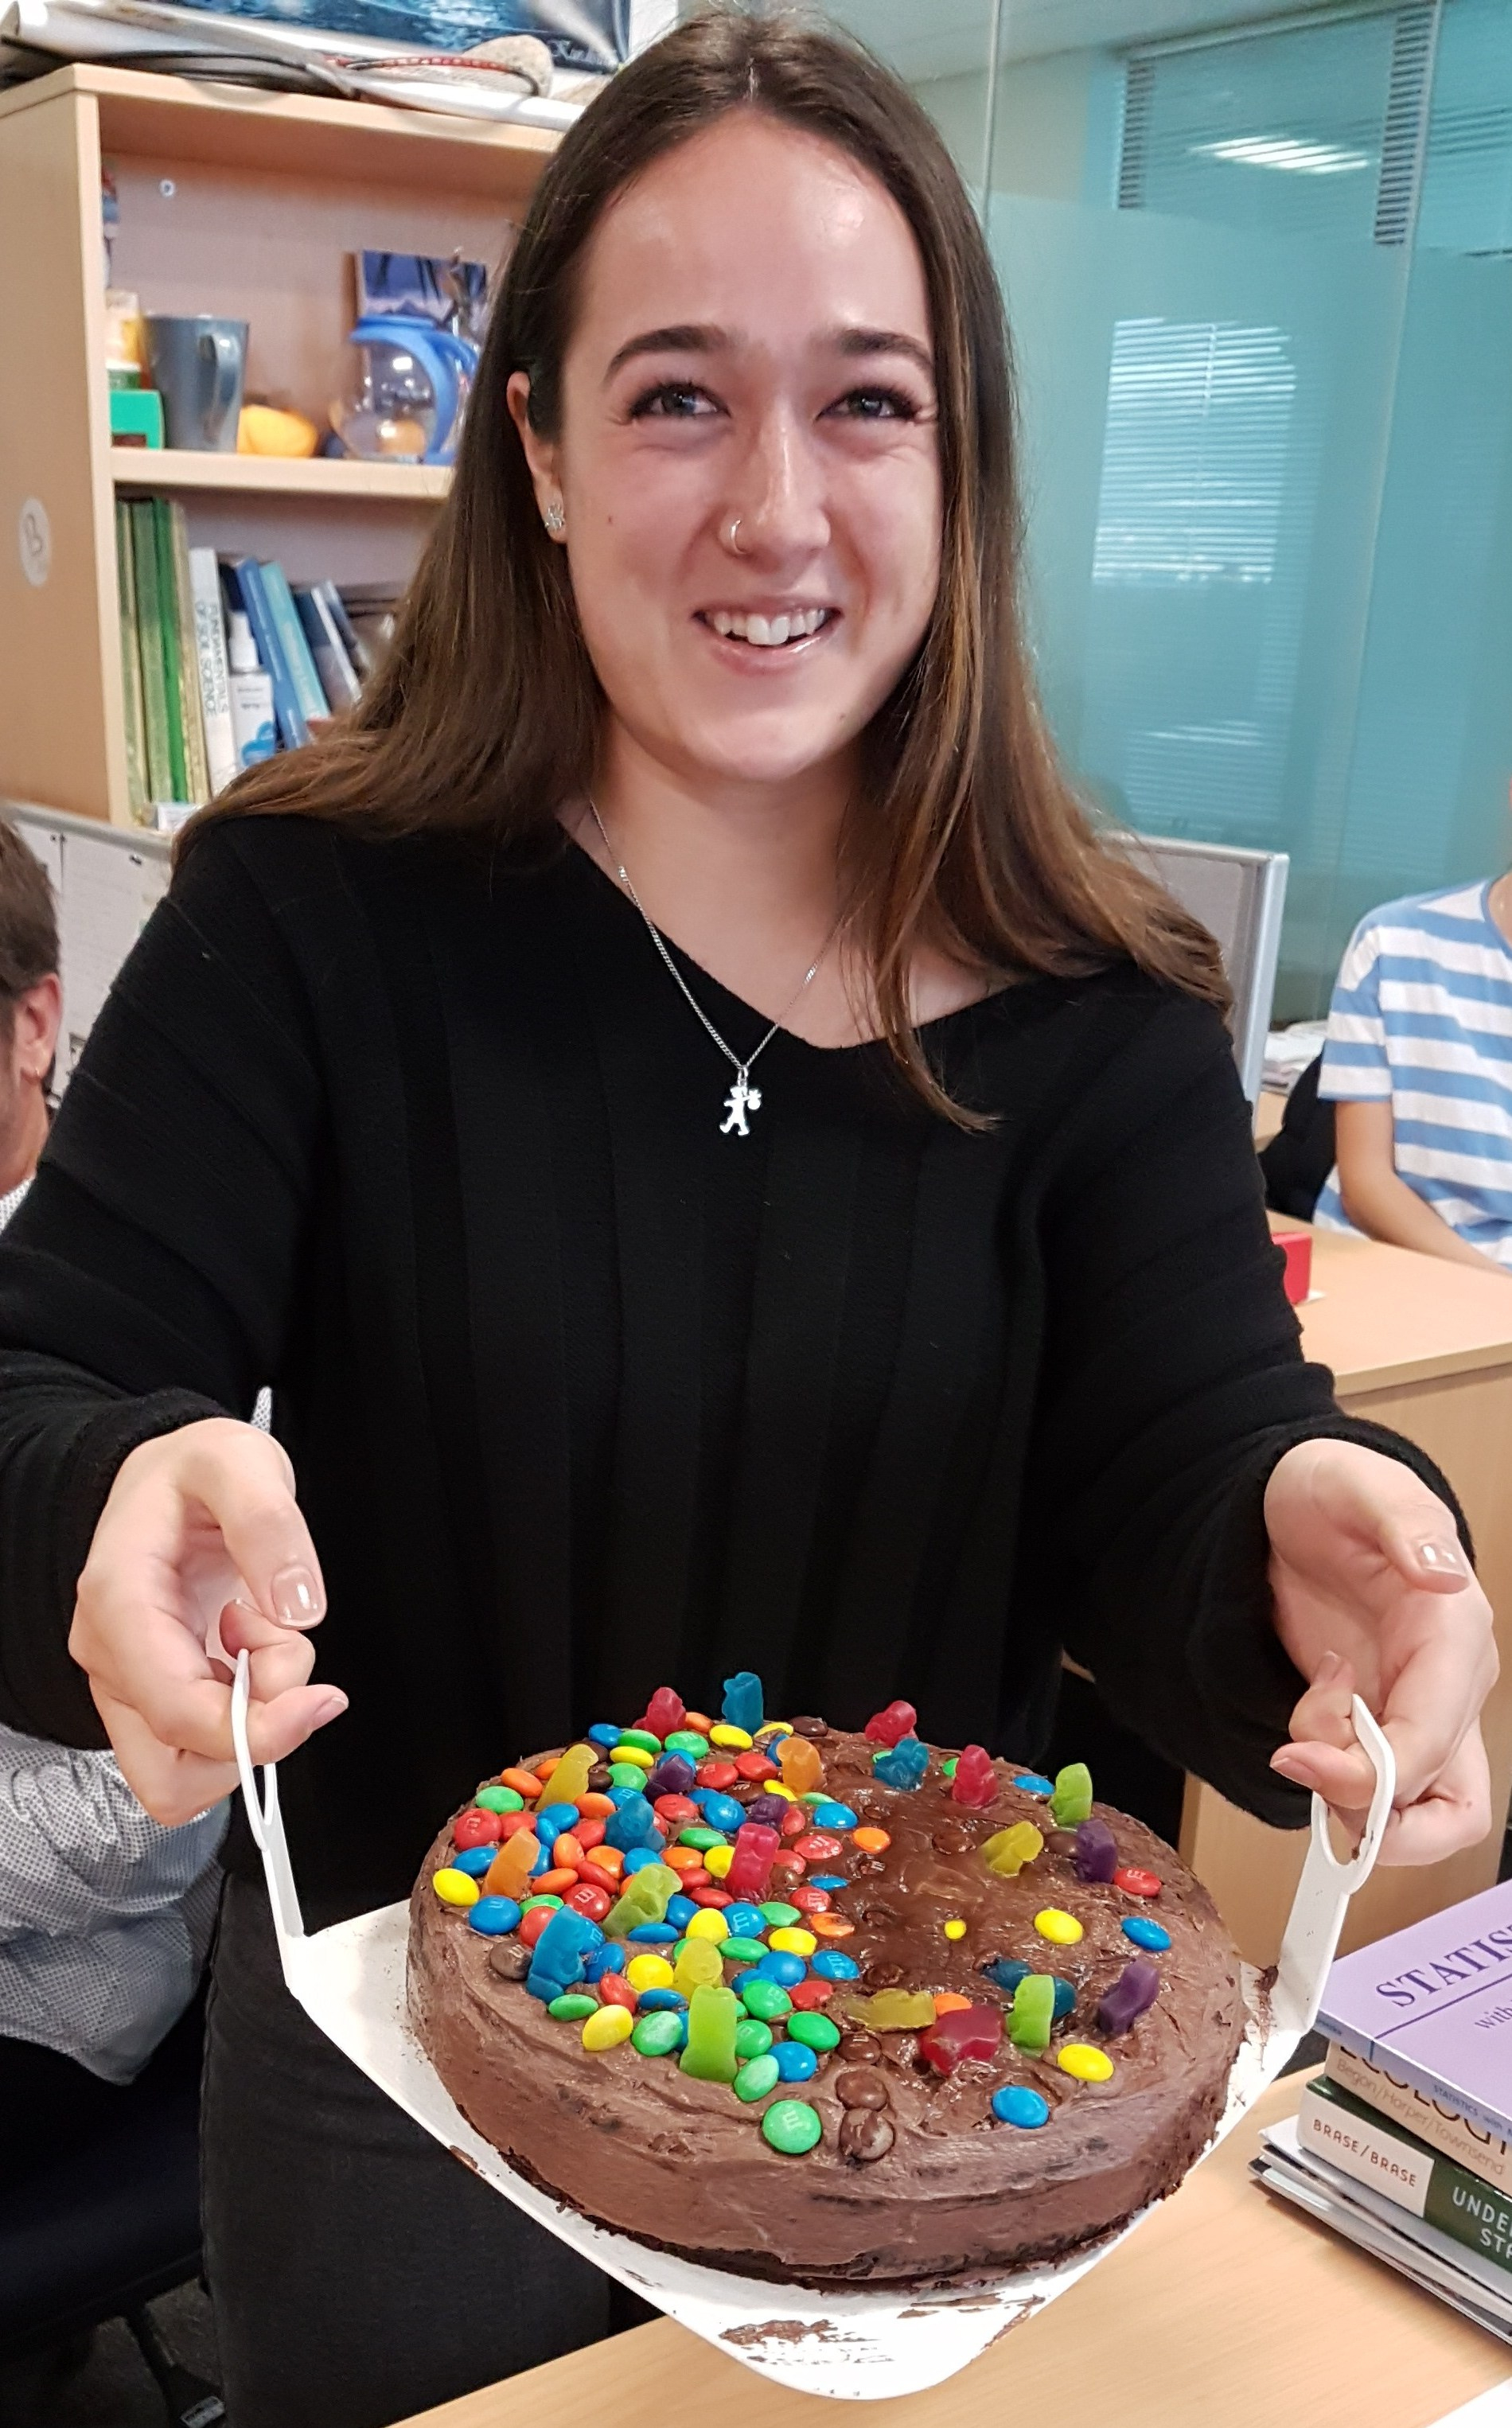
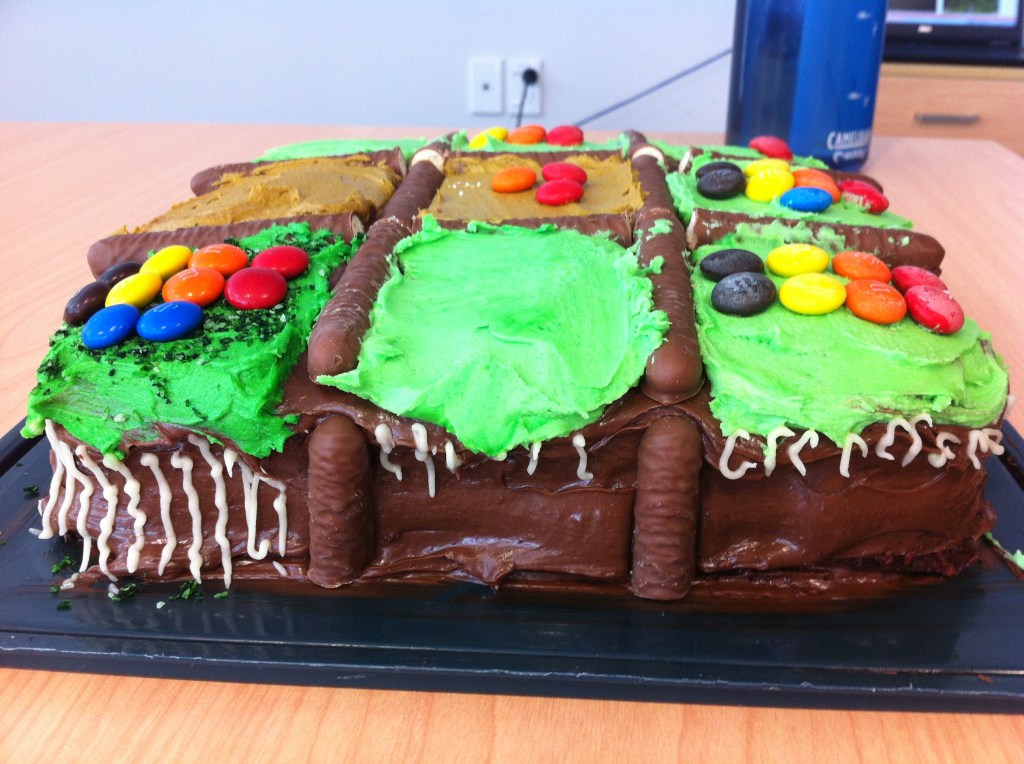
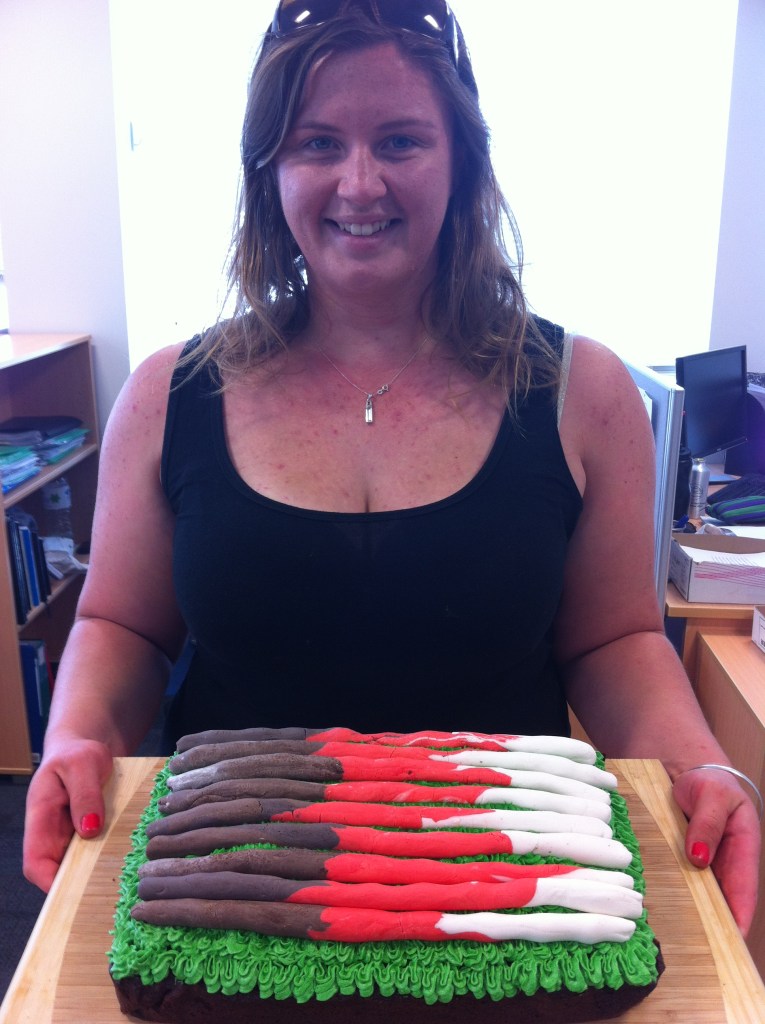
Charlotte Robertson’s MSc project aimed to achieve a 20% reduction in nitrogen (N) leaching from grazed pastures, balancing profitability with environmental sustainability. To do this, she modelled a Canterbury dairy farm in Farmax and OverseerScience and modelled three forages (plantain, fodder beet and oats) into the existing farm management.
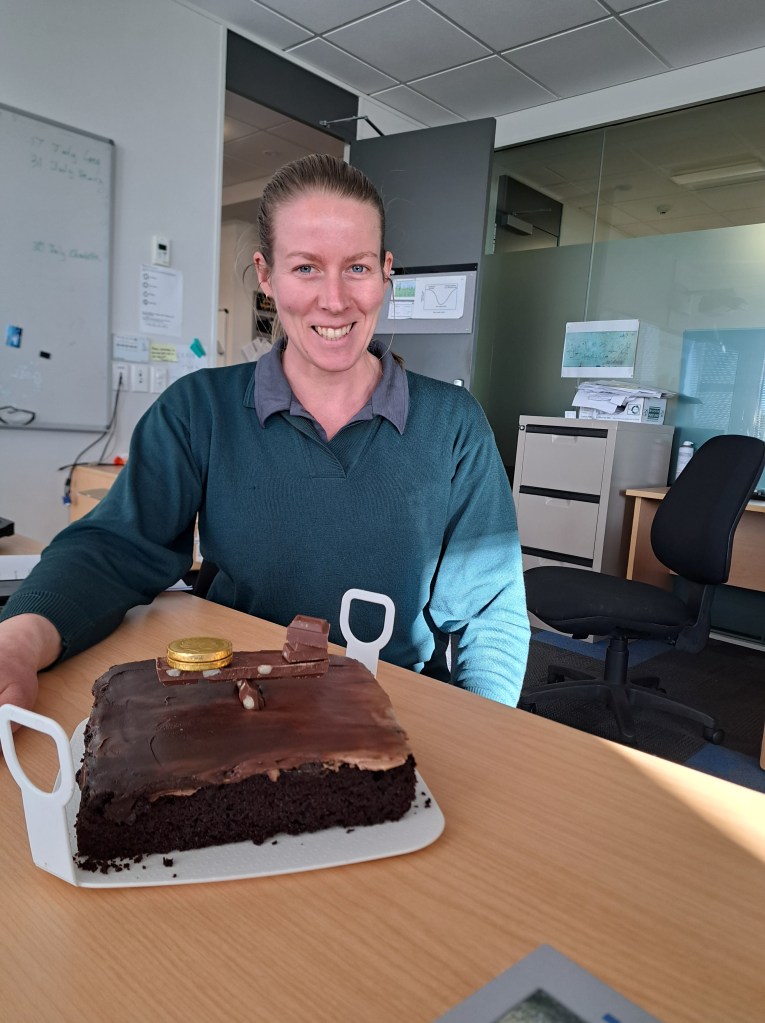
This chocolate cake represents the modeled dairy farm. The icing gradient represents reductions in N leaching from dark chocolate (higher N leaching) to milk chocolate (lower N leaching). The scales on the cake represent the scenario we modelled that demonstrated a 20% reduction in N leaching and a 2% increase in profitability through the incorporation of all three forages. The financial goals (chocolate $$$) and environmental goals (chocolate pieces) were in balance in this particular scenario.
Soil C stocks along a geothermal gradient
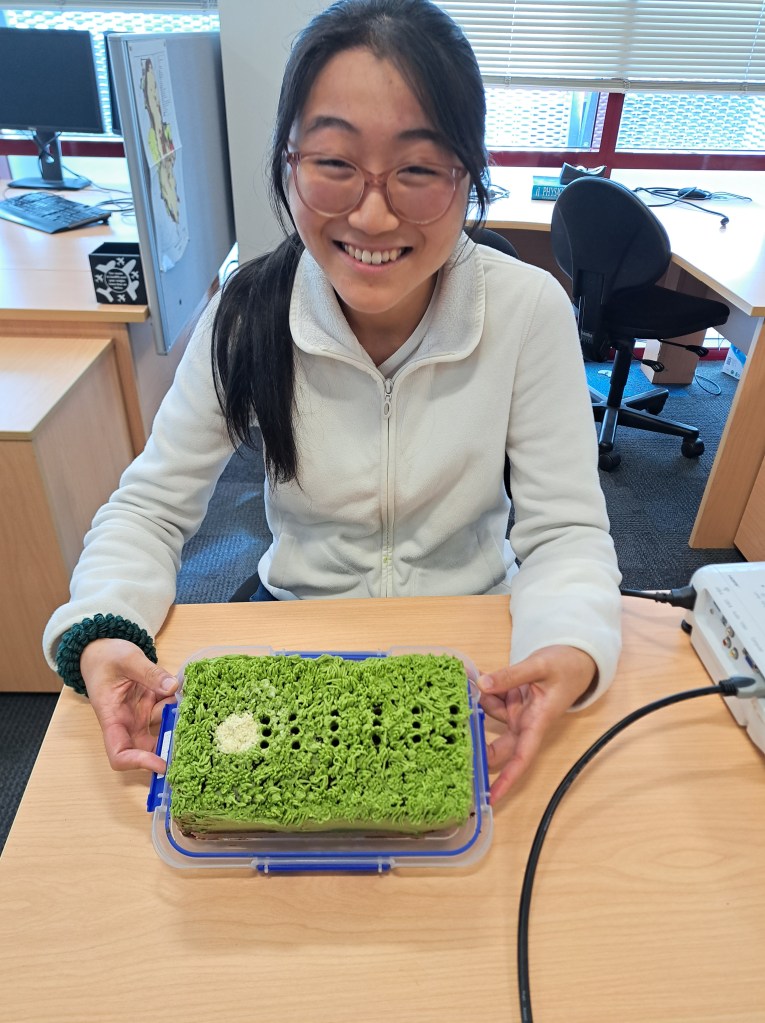
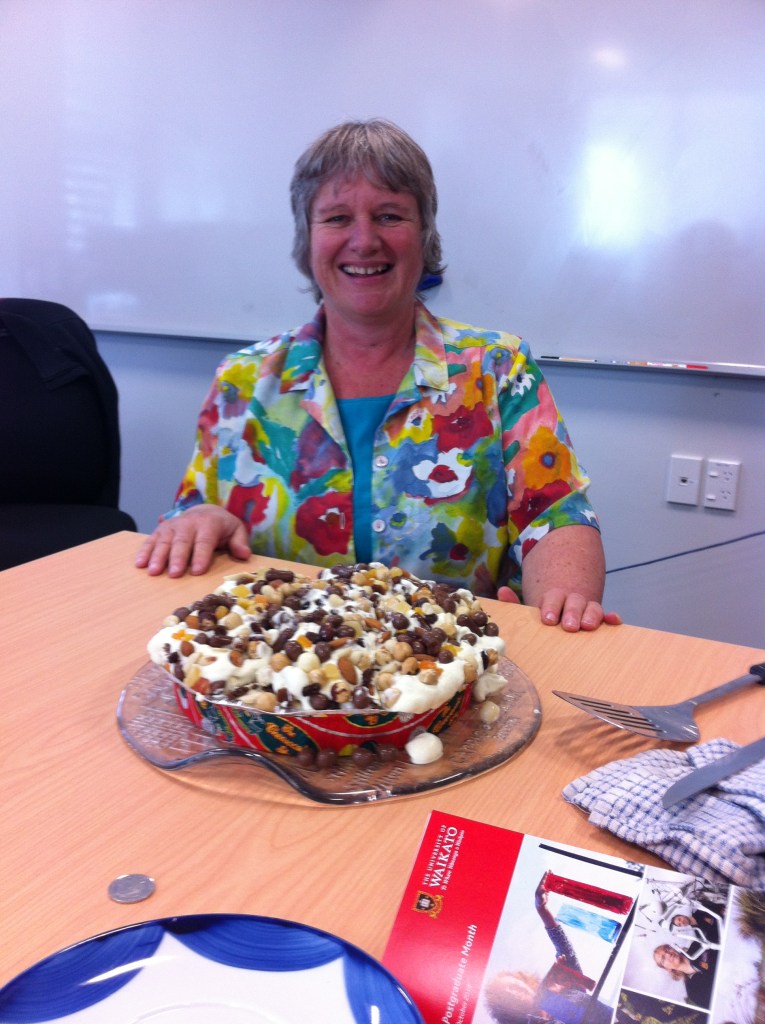
Kelly Chow’s research cake is a schematic of 6 sampling spots across a wide range of soil temperatures along two different geothermal gradients. The white patch represents the geothermal hotspot at about 40oC with limited plant growth. She sampled 3 replicate soil cores (to 40 cm depth) at each site (see holes in cake) and analysed soil for total carbon and nitrogen stocks. She showed that as we moved closer to the hotspot with higher temperatures, there were lower soil C stocks.
Organic controls on metals in karst systems
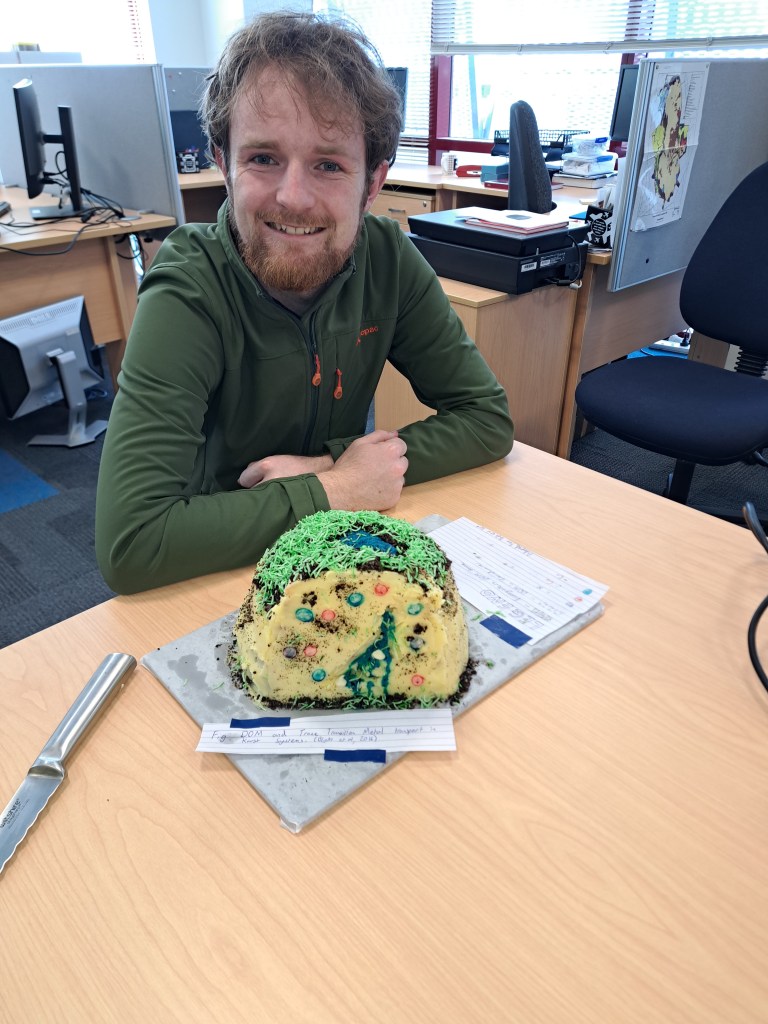
Robert Brodnax made this cake to celebrate his MSc thesis completion. It represents a cross section of a cave in a limestone system, under rich organic soil. Ground water is depicted flowing down into the cave carrying metal ions derived from the overlying soils, Copper, (Red), Cobalt (Blue) and Nickel (Grey) complexed with soil-derived, dissolved organic matter (DOM) (green coconut and Oreo crumb).
Cu, Co, and Ni in cave formations can tell us a lot about past climates, as their availability in caves is linked to rainfall effects. This link is indirect as incorporation of metals into cave formations depends on binding with DOM. The strength of Cu and Co binding in these complexes varies depending on the origin of DOM, meaning that Cu, Co, and Ni content in cave formations depends on factors affecting DOM and rainfall. This variation needs to be accounted for in future efforts to track climate change using transition metal proxies in cave formations.
Does Empodisma build peat bogs by saving water?
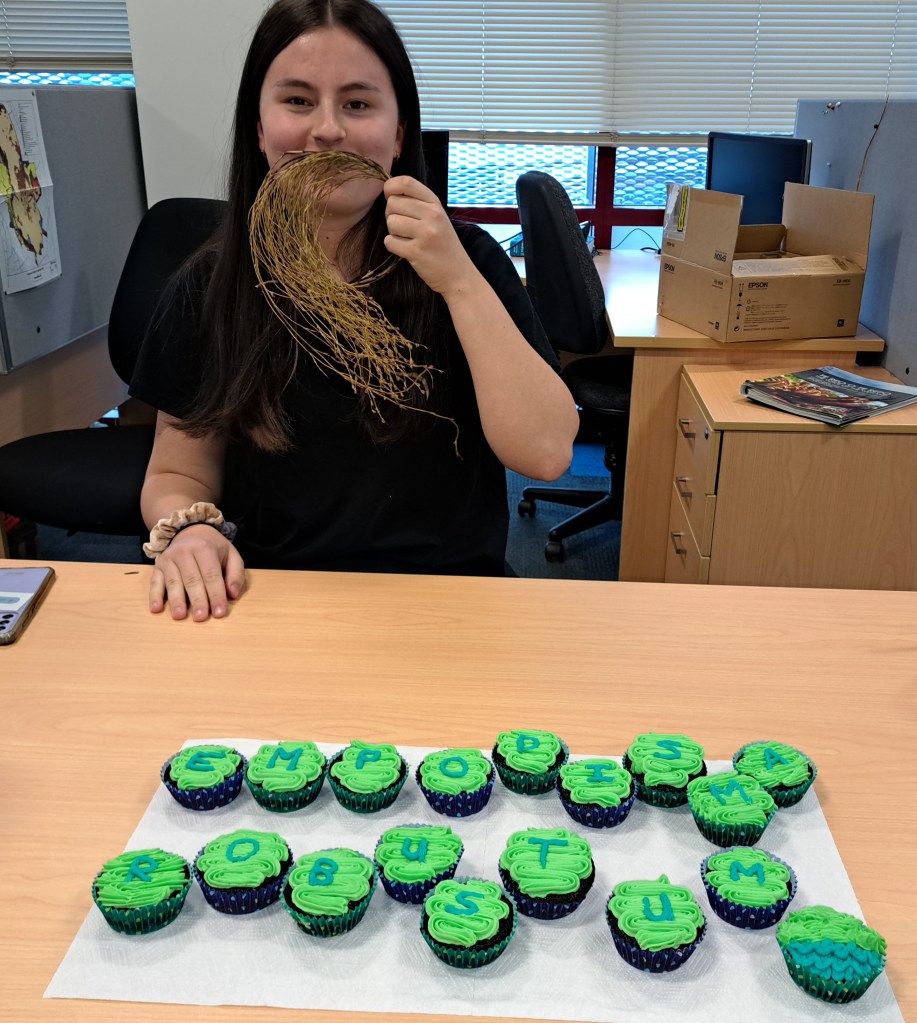
Empodisma robustum research-cupcakes.
As part of her Masters thesis, Leeza Speranskaya examined dry and wet canopy evaporation processes at Kopuatai bog to characterise the effect of the dominant water conservative species Empodisma robustum on evaporation. She showed that Empodisma may enable Kopuatai to be more hydrologically resistant to future climatic drying than Northern Hemisphere peatlands, enabling greater resilience of the carbon sink.
Leeza models a Empodisma moustache.
Colour-forming DGTs
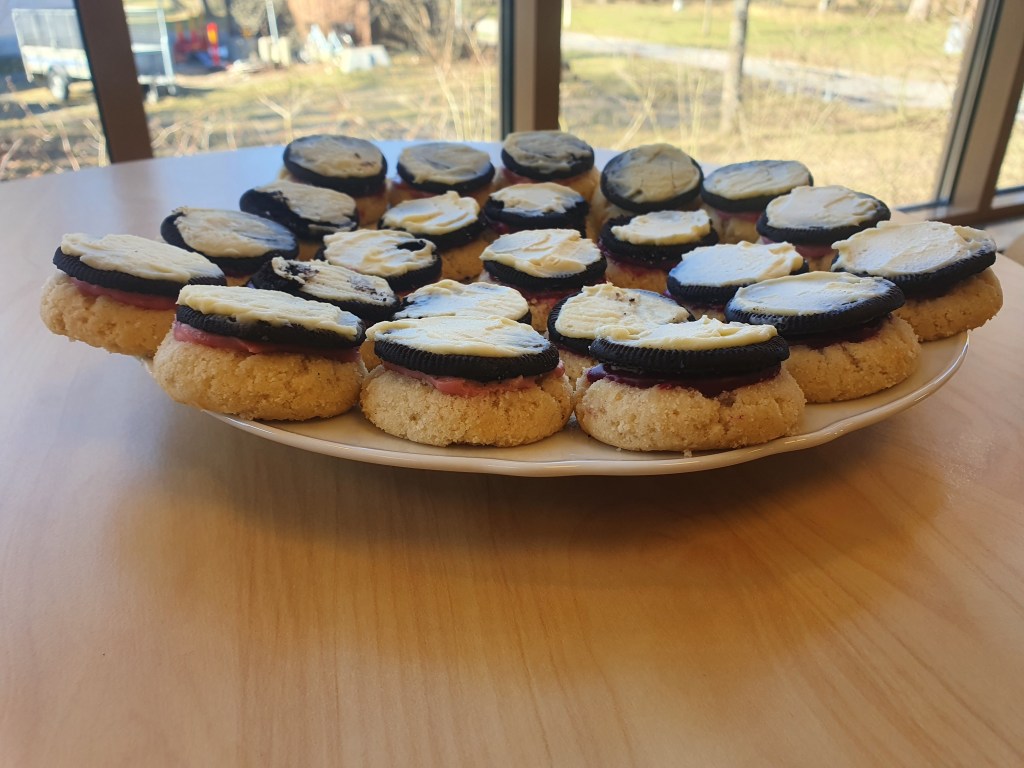
A Researchcake representing Thomas Corbett’s final paper from his PhD where he looked to develop a DGT that formed colour in situ when exposed to dissolved nitrate. The biscuits represent the AuNP binding layer DGTs, for colorimetric determination of nitrate. Each layer represents a different component. The biscuit base is the plastic DGT base, pink/purple layer represents the AuNP binding layer that changes colour with different bound nitrite masses, the black biscuit layer represents the dialysis membrane and Fe(0) nitrate reduction layer, and the white icing is the filter membrane.
Temperature response of methanogenesis in peats
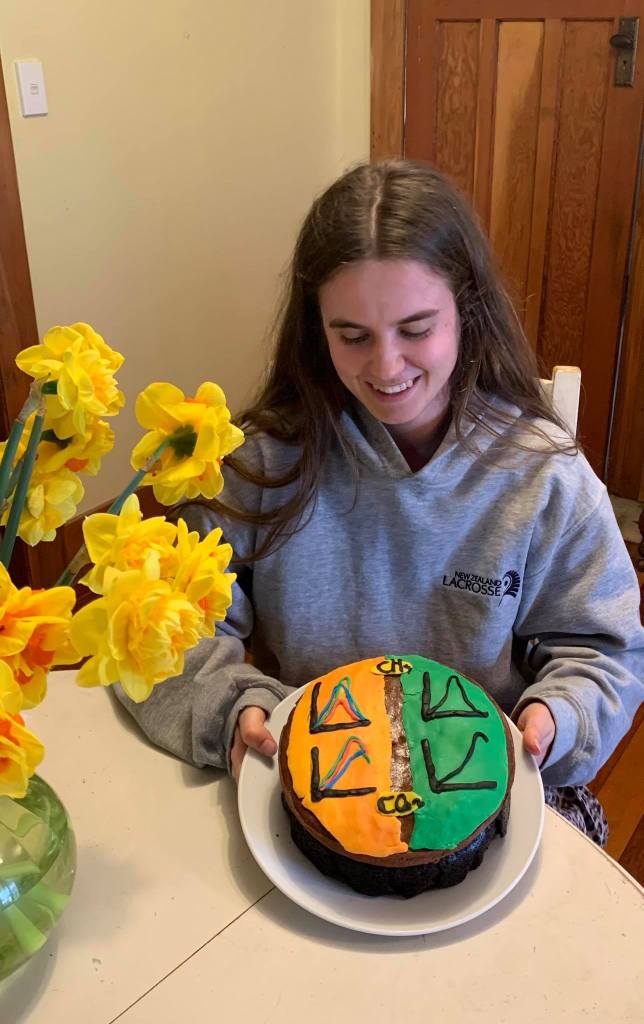
This research cake represents Alice Wheatley-Wilson’s MSc project on the temperature dependence of anaerobic methane and carbon dioxide production from intact and drained peatlands. The cake features an aerial view of an intact peatland (orange half) and a drained peatland used for pasture (green half). The dark brown bottom layer of the cake represents a belowground view of drained peat, while the light brown upper layer represents intact peat.
The two figures on the upper half of the cake describe the temperature response curvature of methane production modelled with MMRT from each site, while the two lower figures describe the temperature response curvature of CO2 production. At the intact site, peat was collected under Empodisma (blue), sedge (green) and manuka (pink) vegetation, while there was only the one sampling location at the drained peat site (black).
You will find an example of these figures in Alice’s thesis – although these won’t taste as good as those pictured here.
A geothermal gradient to study microbial thermal adaptation
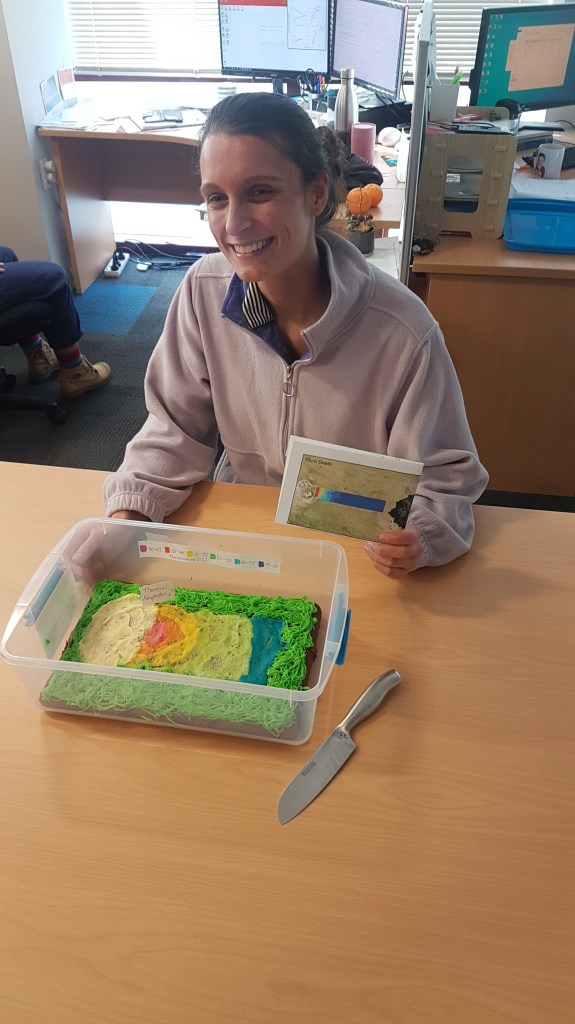
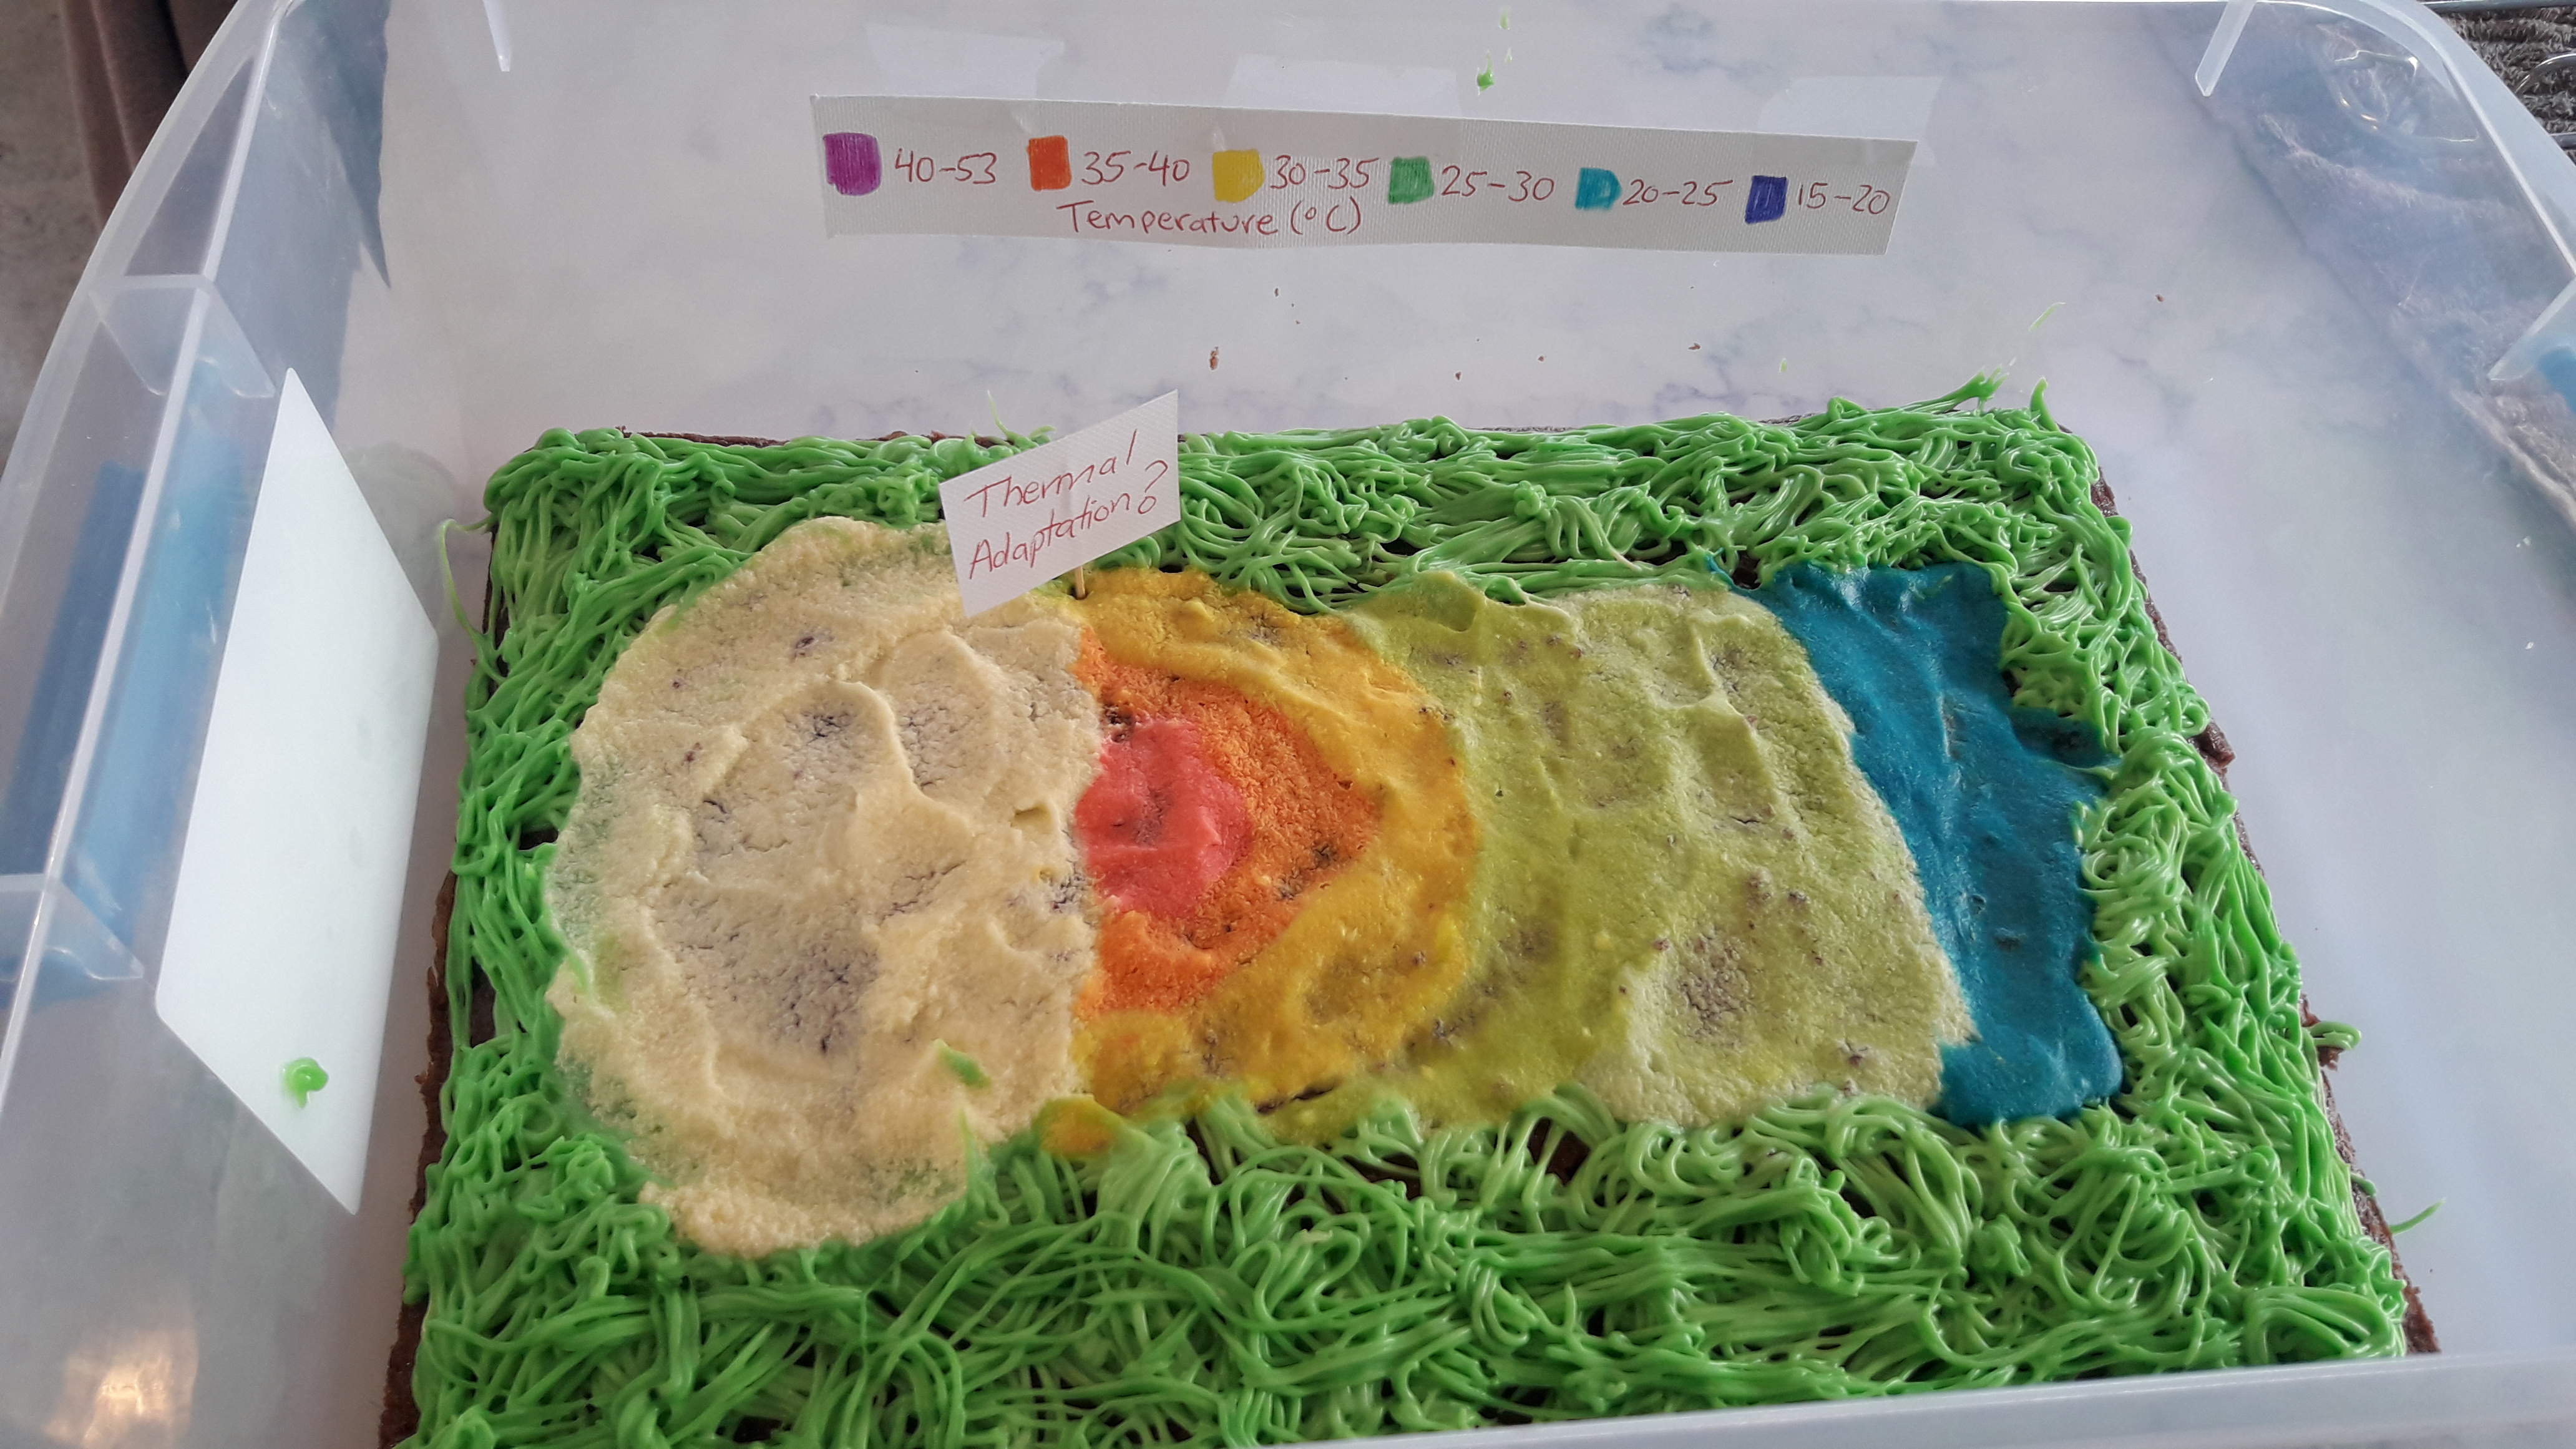
Ally van de Laar’s MSc project investigated the temperature response of microbial respiration and soil priming along the length of a geothermal gradient which contained a range of environmental temperatures. The research cake was designed to look like my field site. The large white oval is the geothermal feature studied in my thesis. The coloured icing moving away from the feature represents the temperature gradient observed at the site (the colours correspond to the legend temperatures). The “Thermal Adaptation?” sign refers to the conclusions of the research where minimal thermal adaptation to sustained soil warming was observed close to the geothermal source. The “?” was added because the observed adaptation was very small and so whether it actually occurred is unknown.
Methane flux from wetlands
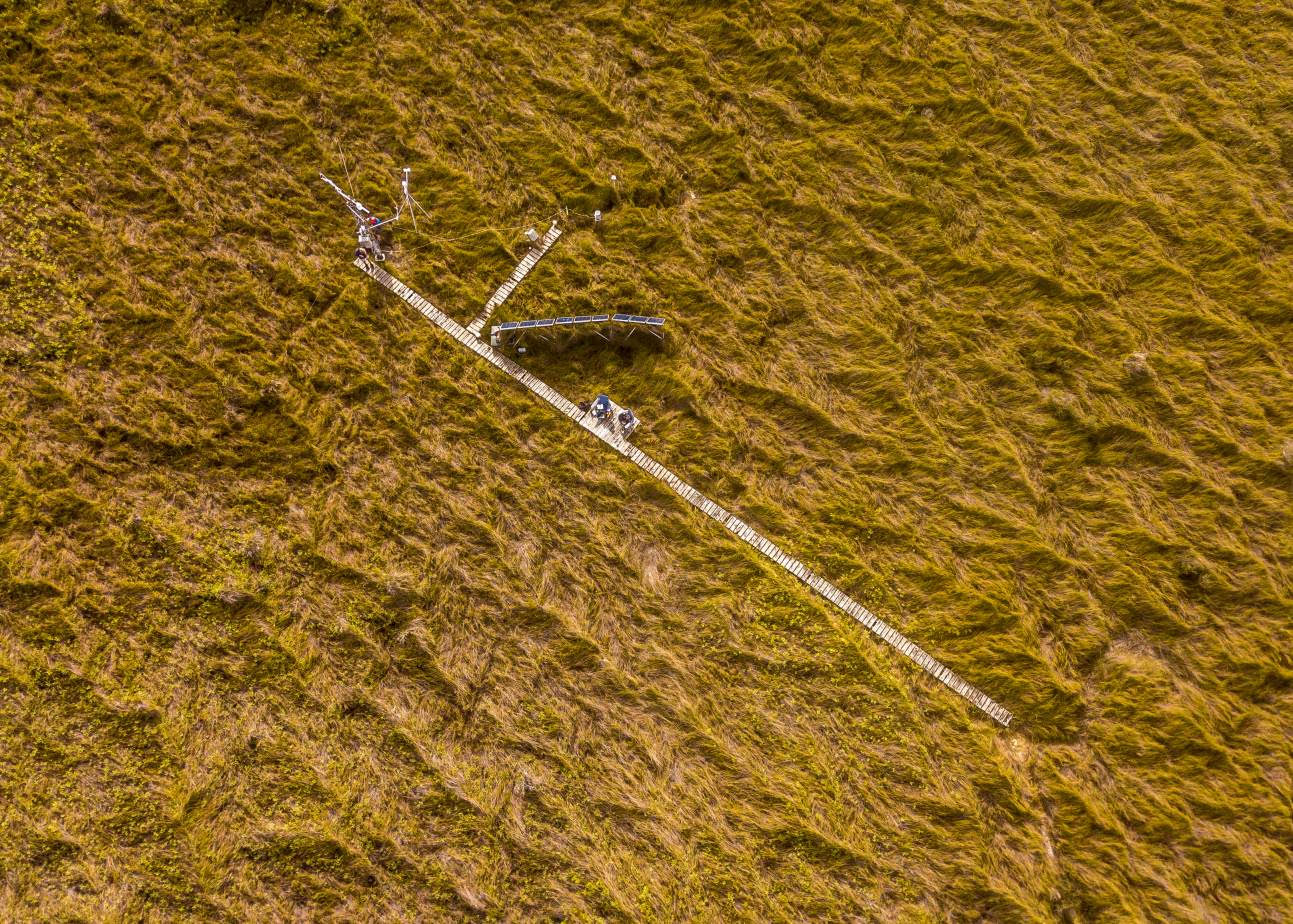
A dual-purpose research cake: 1. To celebrate a recent spate of papers published from the global FLUXNET-CH4 project which have included a four-year dataset of methane fluxes from the Kopuatai Bog EC site. 2. Georgie Glover-Clark (left) is leaving WaiBER to start a new position at Manaaki Whenua Landcare Research. Georgie has been working as a research assistant with Dave Campbell (right) since March 2020. The cake: a deep, rich chocolate cake representing 11 thousand years of carbon accumulation as peat at Kopuatai (averaging 2,400 t C/ha). The surface texture on the icing represents the Empodisma robustum (jointed wire rush) vegetation that is the key peat-former in northern Aotearoa. The lighter patches represent the huge amount of standing dead litter that acts as a mulch to conserve water. The strange-looking shape made out of liquorice is not a military-style weapon! See the photo below – it’s the EC site boardwalk, solar panels and tower as seen from above in the amazing photos Georgie took recently using her drone.
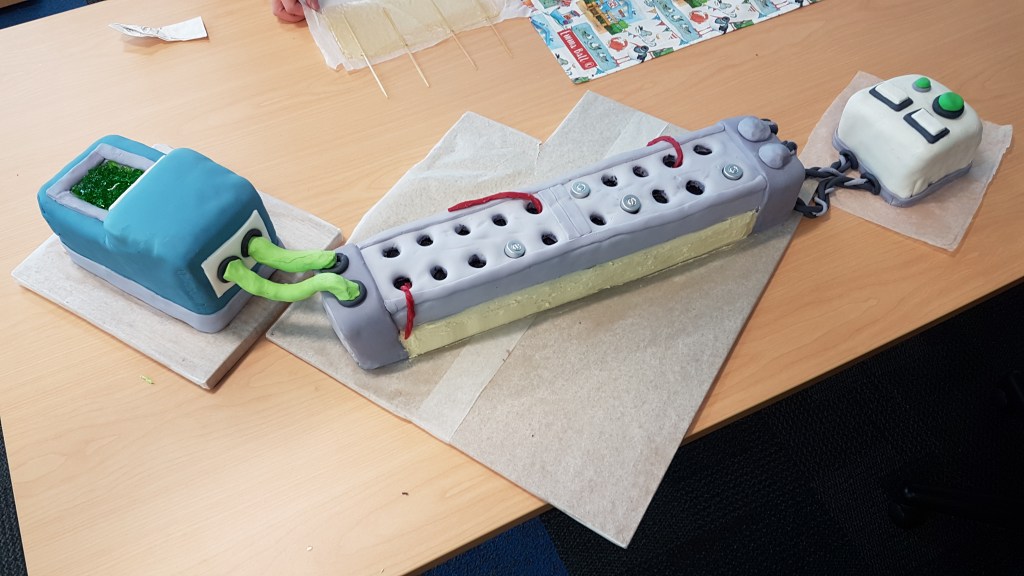
Developing new DGT for water quality monitoring
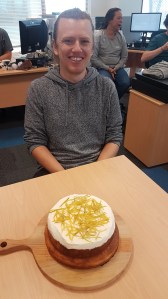
The cake represents a Bromide-DGT probe – each component symbolises a different part of the new DGT/flow rate method. The cake body (lemon sponge) represents the DGT probe, the lemon curd (under the cream) the bromide specific binding layer, and the cream is the diffusive layer. The candied peel illustrates multiple components, the ‘flowing’ shapes are the flow of the water in the stream which carries the added bromide salt (sugar coating), part of which diffuses through the cream diffusive layer.
https://www.sciencedirect.com/science/article/pii/S0048969721028084
Adding one piece to the puzzle
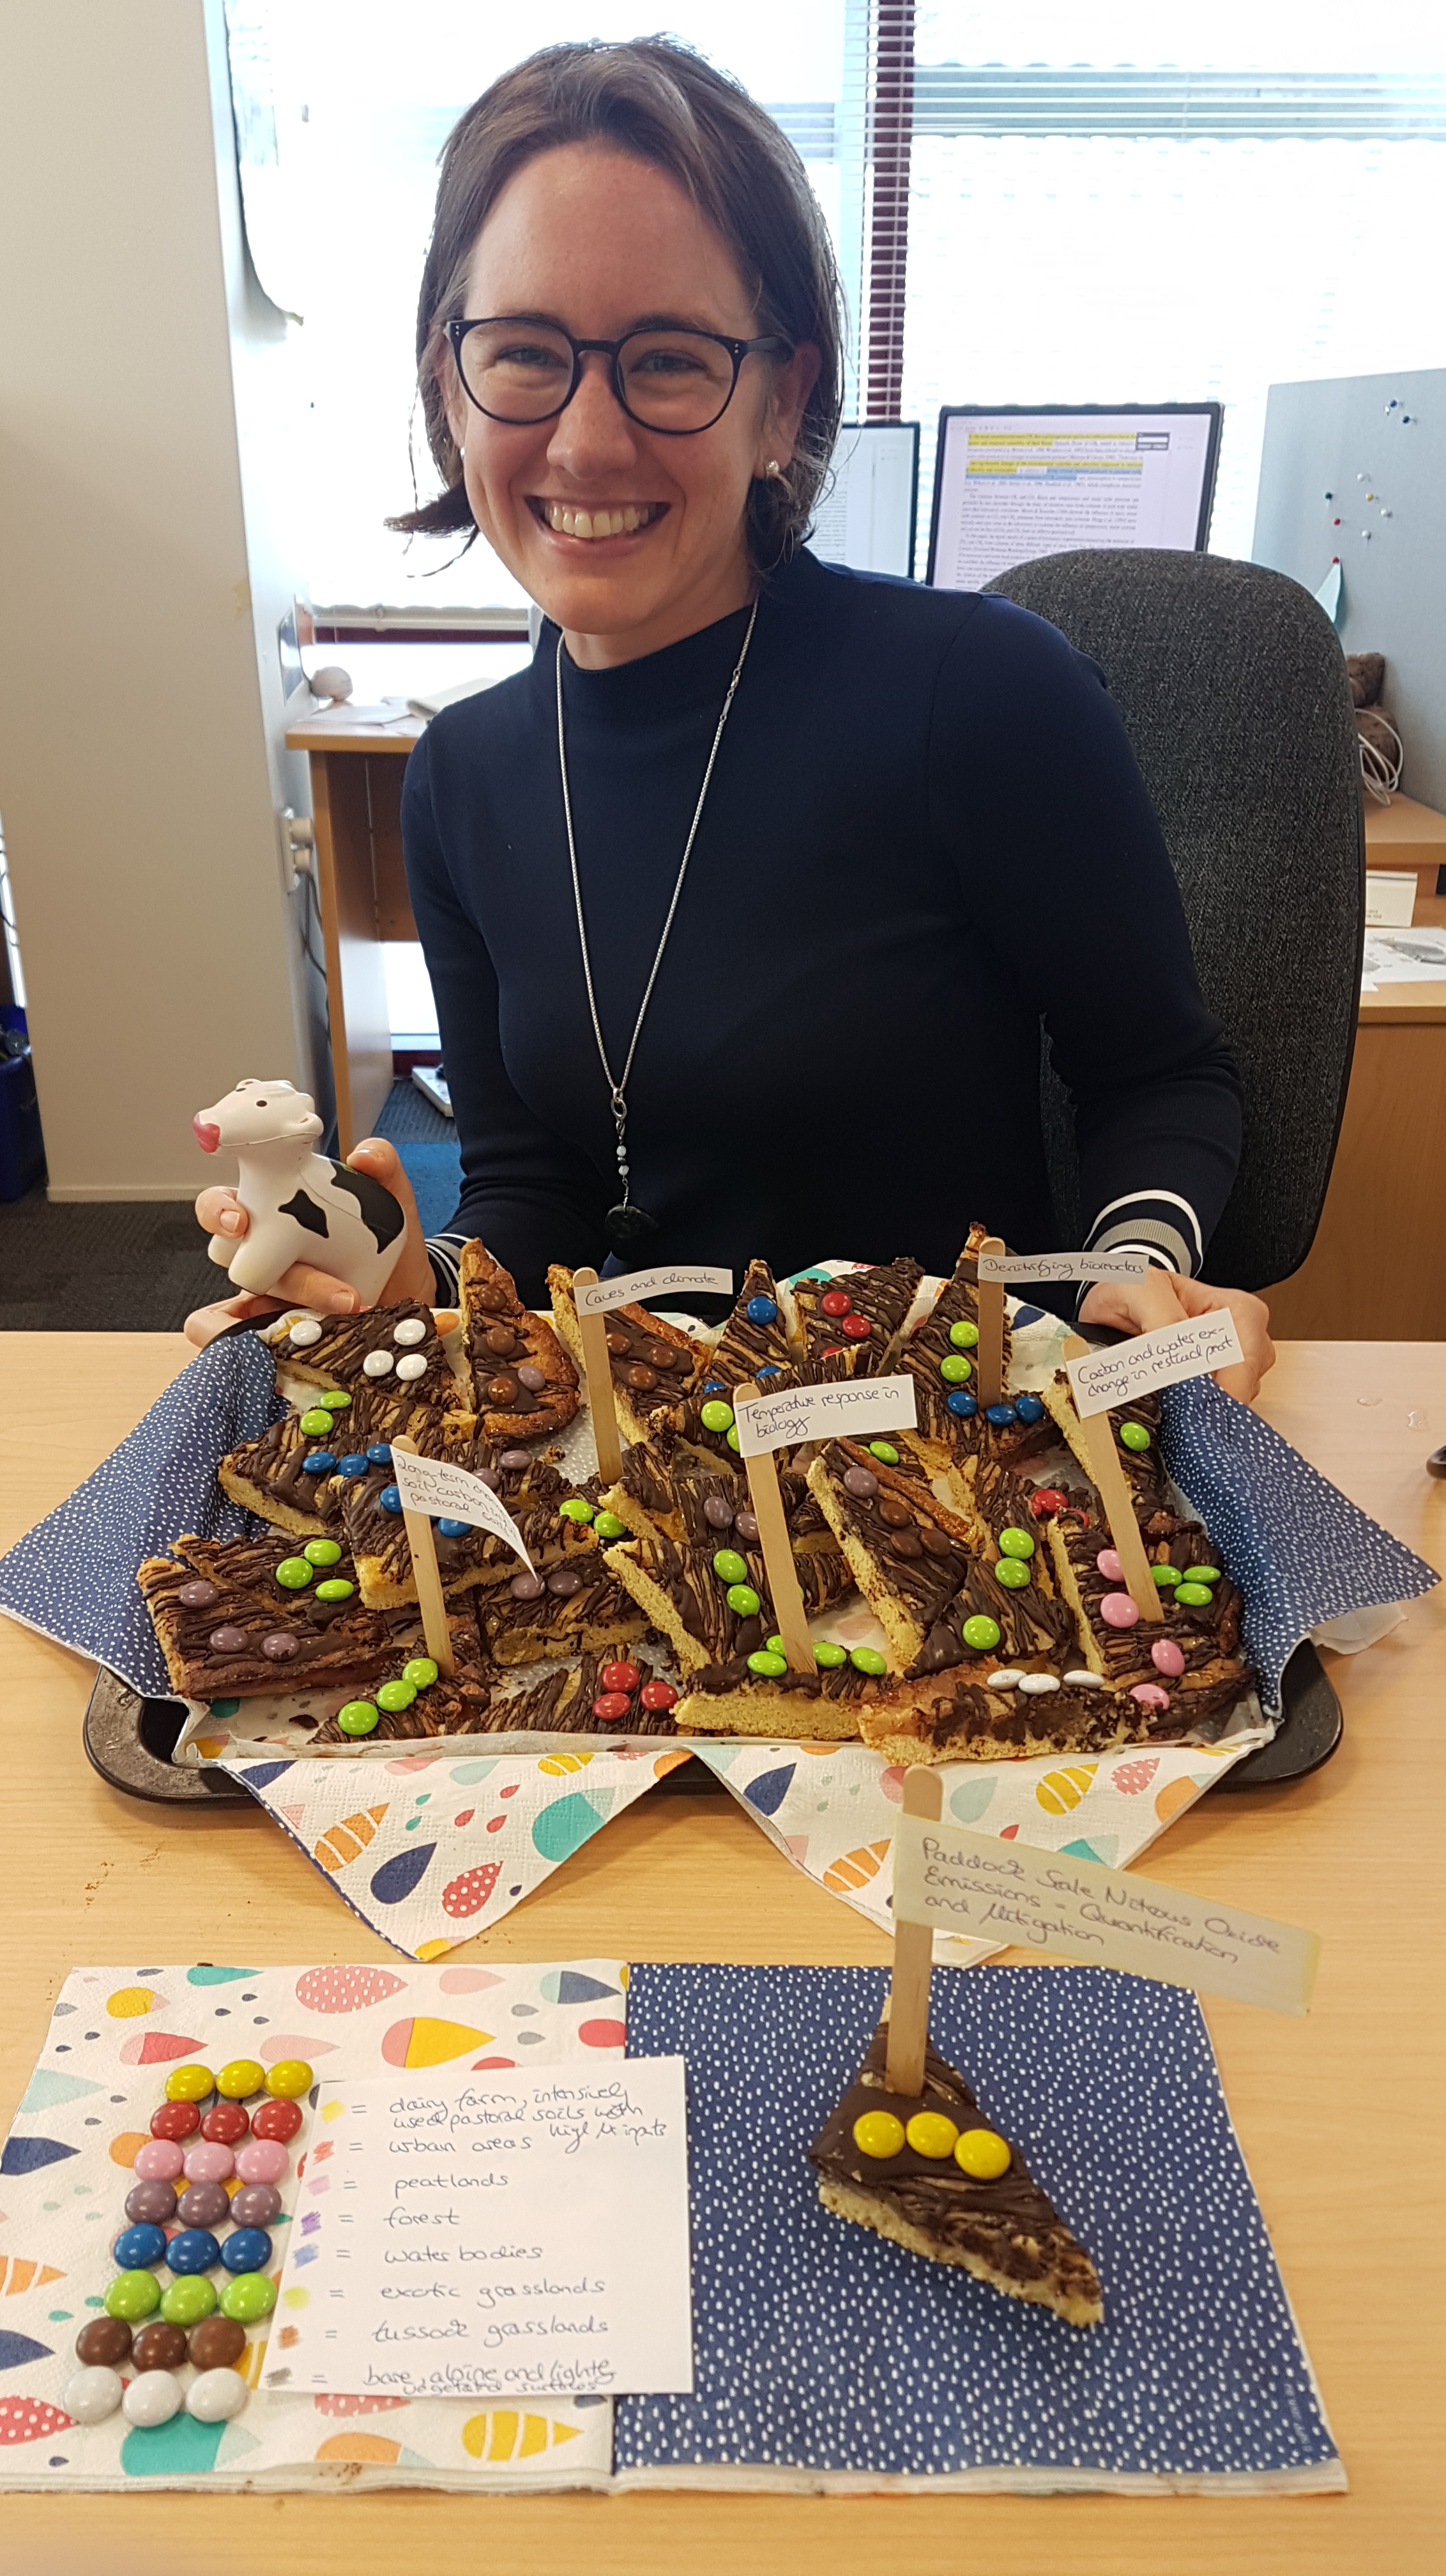
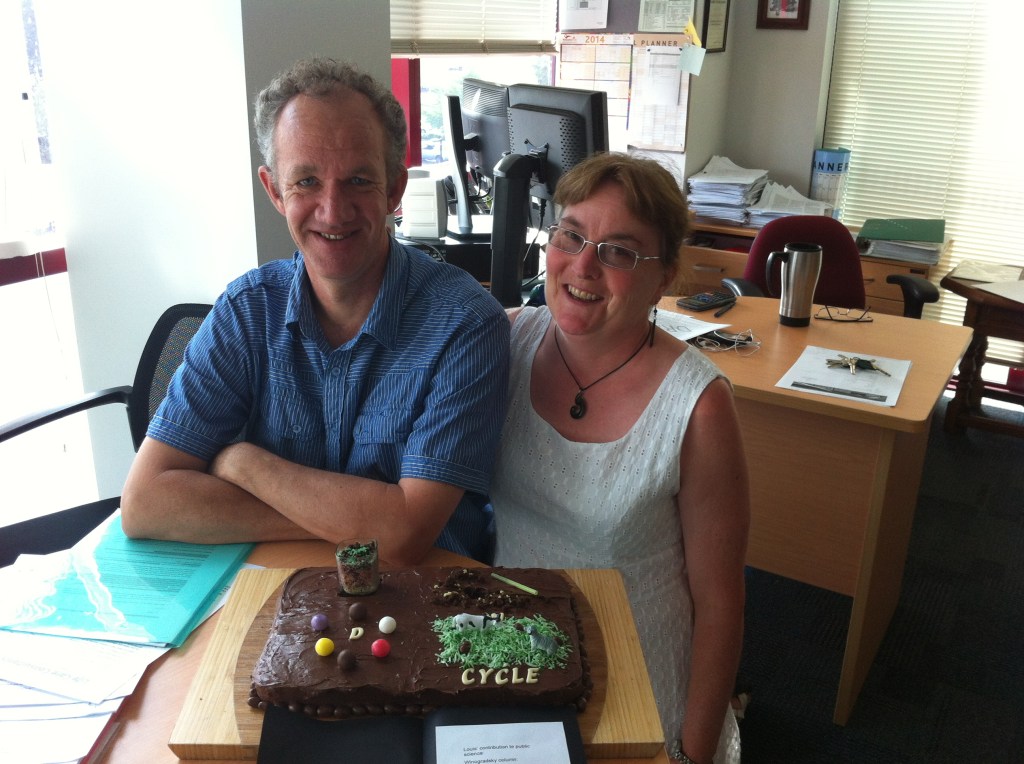
This is a relatively abstract research cake celebrating Anne handing in her PhD thesis as well as having her second paper being accepted for publication. The cake comprises individual pieces of nutty triangles (a German delicacy) with each depicting a different compartment of the New Zealand landscape (colour of the smarties): e.g. urban areas in red, forests in purple and exotic grasslands in green. One nutty triangle has been decorated in cow-urine-yellow; and this shall highlight the contribution of Anne’s PhD thesis ‘Paddock scale nitrous oxide emissions: quantification and mitigation’ to the pool of scientific knowledge (labels attached to Popsicles).
Anne’s work has added one more piece to a great puzzle, which is to understand how the world works. The chaotic order with which the triangles were placed on the tray shall remind us to favour holistic approaches over fragmentation. Basically like a puzzle – bringing it all back together and aiming for a global perspective.
Peat surface oscillation
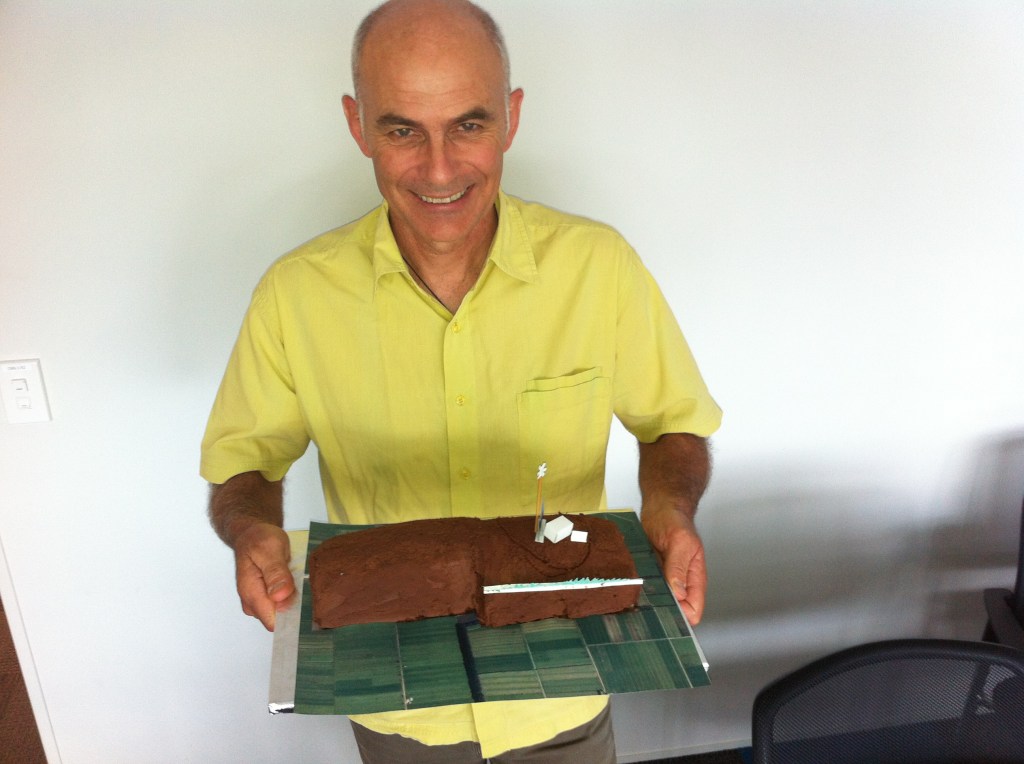
This research cake illustrates a chapter of Georgie’s MSc thesis, which focused on quantifying the spatio-temporal variability of surface oscillations in a drained agricultural peatland. Each half of the cake represents the two sites with contrasting drainage designs that Georgie measured in her study. One half shows hump and hollow style drainage with blue fondant strips representing shallow surface drains, and the other, border-ditch drainage that has deep drains surrounding each paddock. The small blue dots are indicative of dipwell locations used to monitor both water table depth below the peat surface, and in two dipwells at each site, peat surface oscillations using a paired pressure transducer approach. The gummy figures represent the VX laser survey technique for measurement of spatial changes in peat surface elevation, with the total station (white), prism (purple), and Georgie (green). A greater range of PSO was measured at the site with hump and hollow drainage, including considerably more shrinkage, which is why that half of the cake is at a lower elevation than the other side (to scale).
Temperature response of different soil carbon pools
This research cake illustrates the foundation of Kristyn Numa’s MSc research where she looked at separating the temperature response of the decomposition of labile and stable carbon in soil. Kristyn found that the temperature response of soil respiration from these two pools were distinctly different from each other. Decomposition of the labile pool was dominated by biological processes exhibiting curvature that fits well to macromolecular rate theory. On the other hand, physiochemical processes that exhibited an Arrhenius-like curvature dominated the temperature response of stable carbon. This cake is a representation of the substrate availability theory, which attributes the difference in the temperature response to differences in availability of carbon. One half of the cake represents the labile carbon pool, where carbon is highly available to the microbes for decomposition – hence, a lot of carbon (M&M’s) surrounding the microbes (gummies lollies). On the other stable carbon pool half, there are much fewer M&M’s (AKA carbon) surrounding the gummy microbes – indicating that there was less carbon available to these microbes.
A new way of monitoring nitrate in water
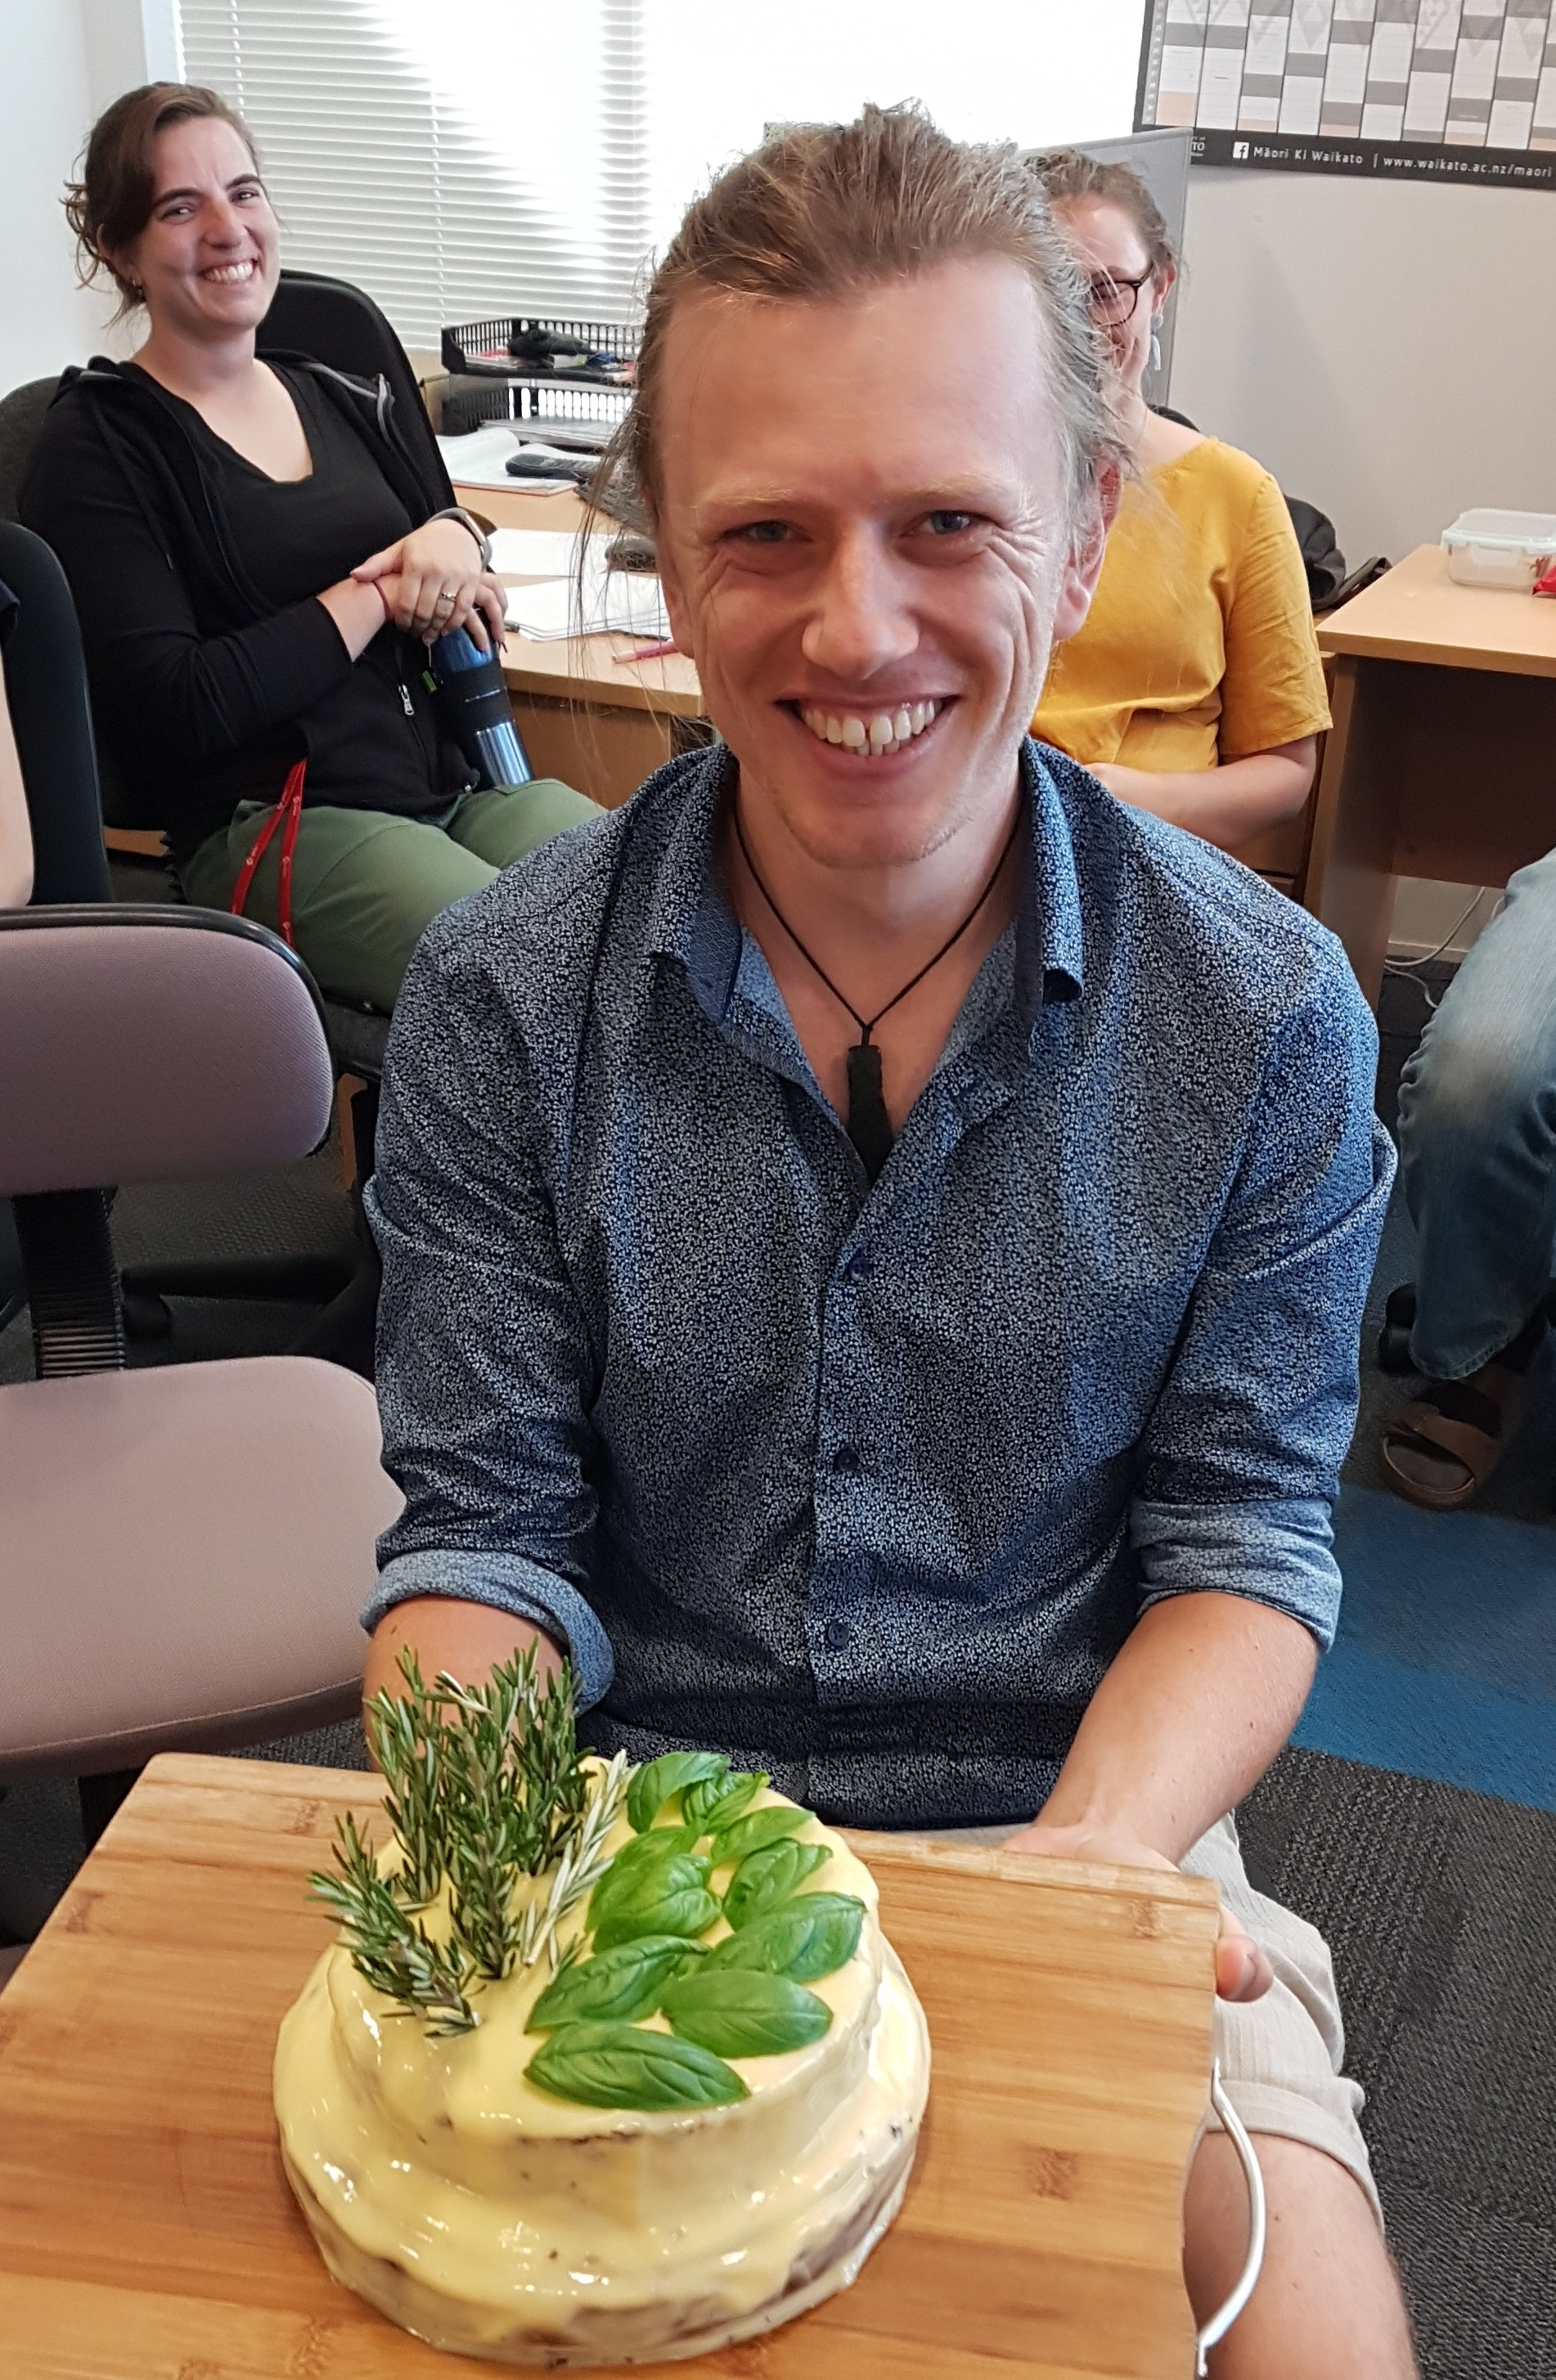
Diffusive gradients through thin film (DGT) were successfully deployed in bioreactors as reported in a newly published paper by Thomas Corbett as part of his PhD. DGT are a passive sampling approach that capture the average concentration of nitrate in water during deployment (often more than 24 h) and reduces errors that can occur with grab sampling. For this research cake, instead of the DGT being in the bioreactor, the bioreactor is in the DGT. The shape of the cake represents the DGT, the icing is the same colour as the nitrate specific binding resin. The lower banana cake represents the wood chips, and the chocolate cake the soil layer overlaying the wood chips. Lastly, the basil and rosemary represent the pasture and native wetland species planted on the two bioreactors.
Water and energy exchange in peats
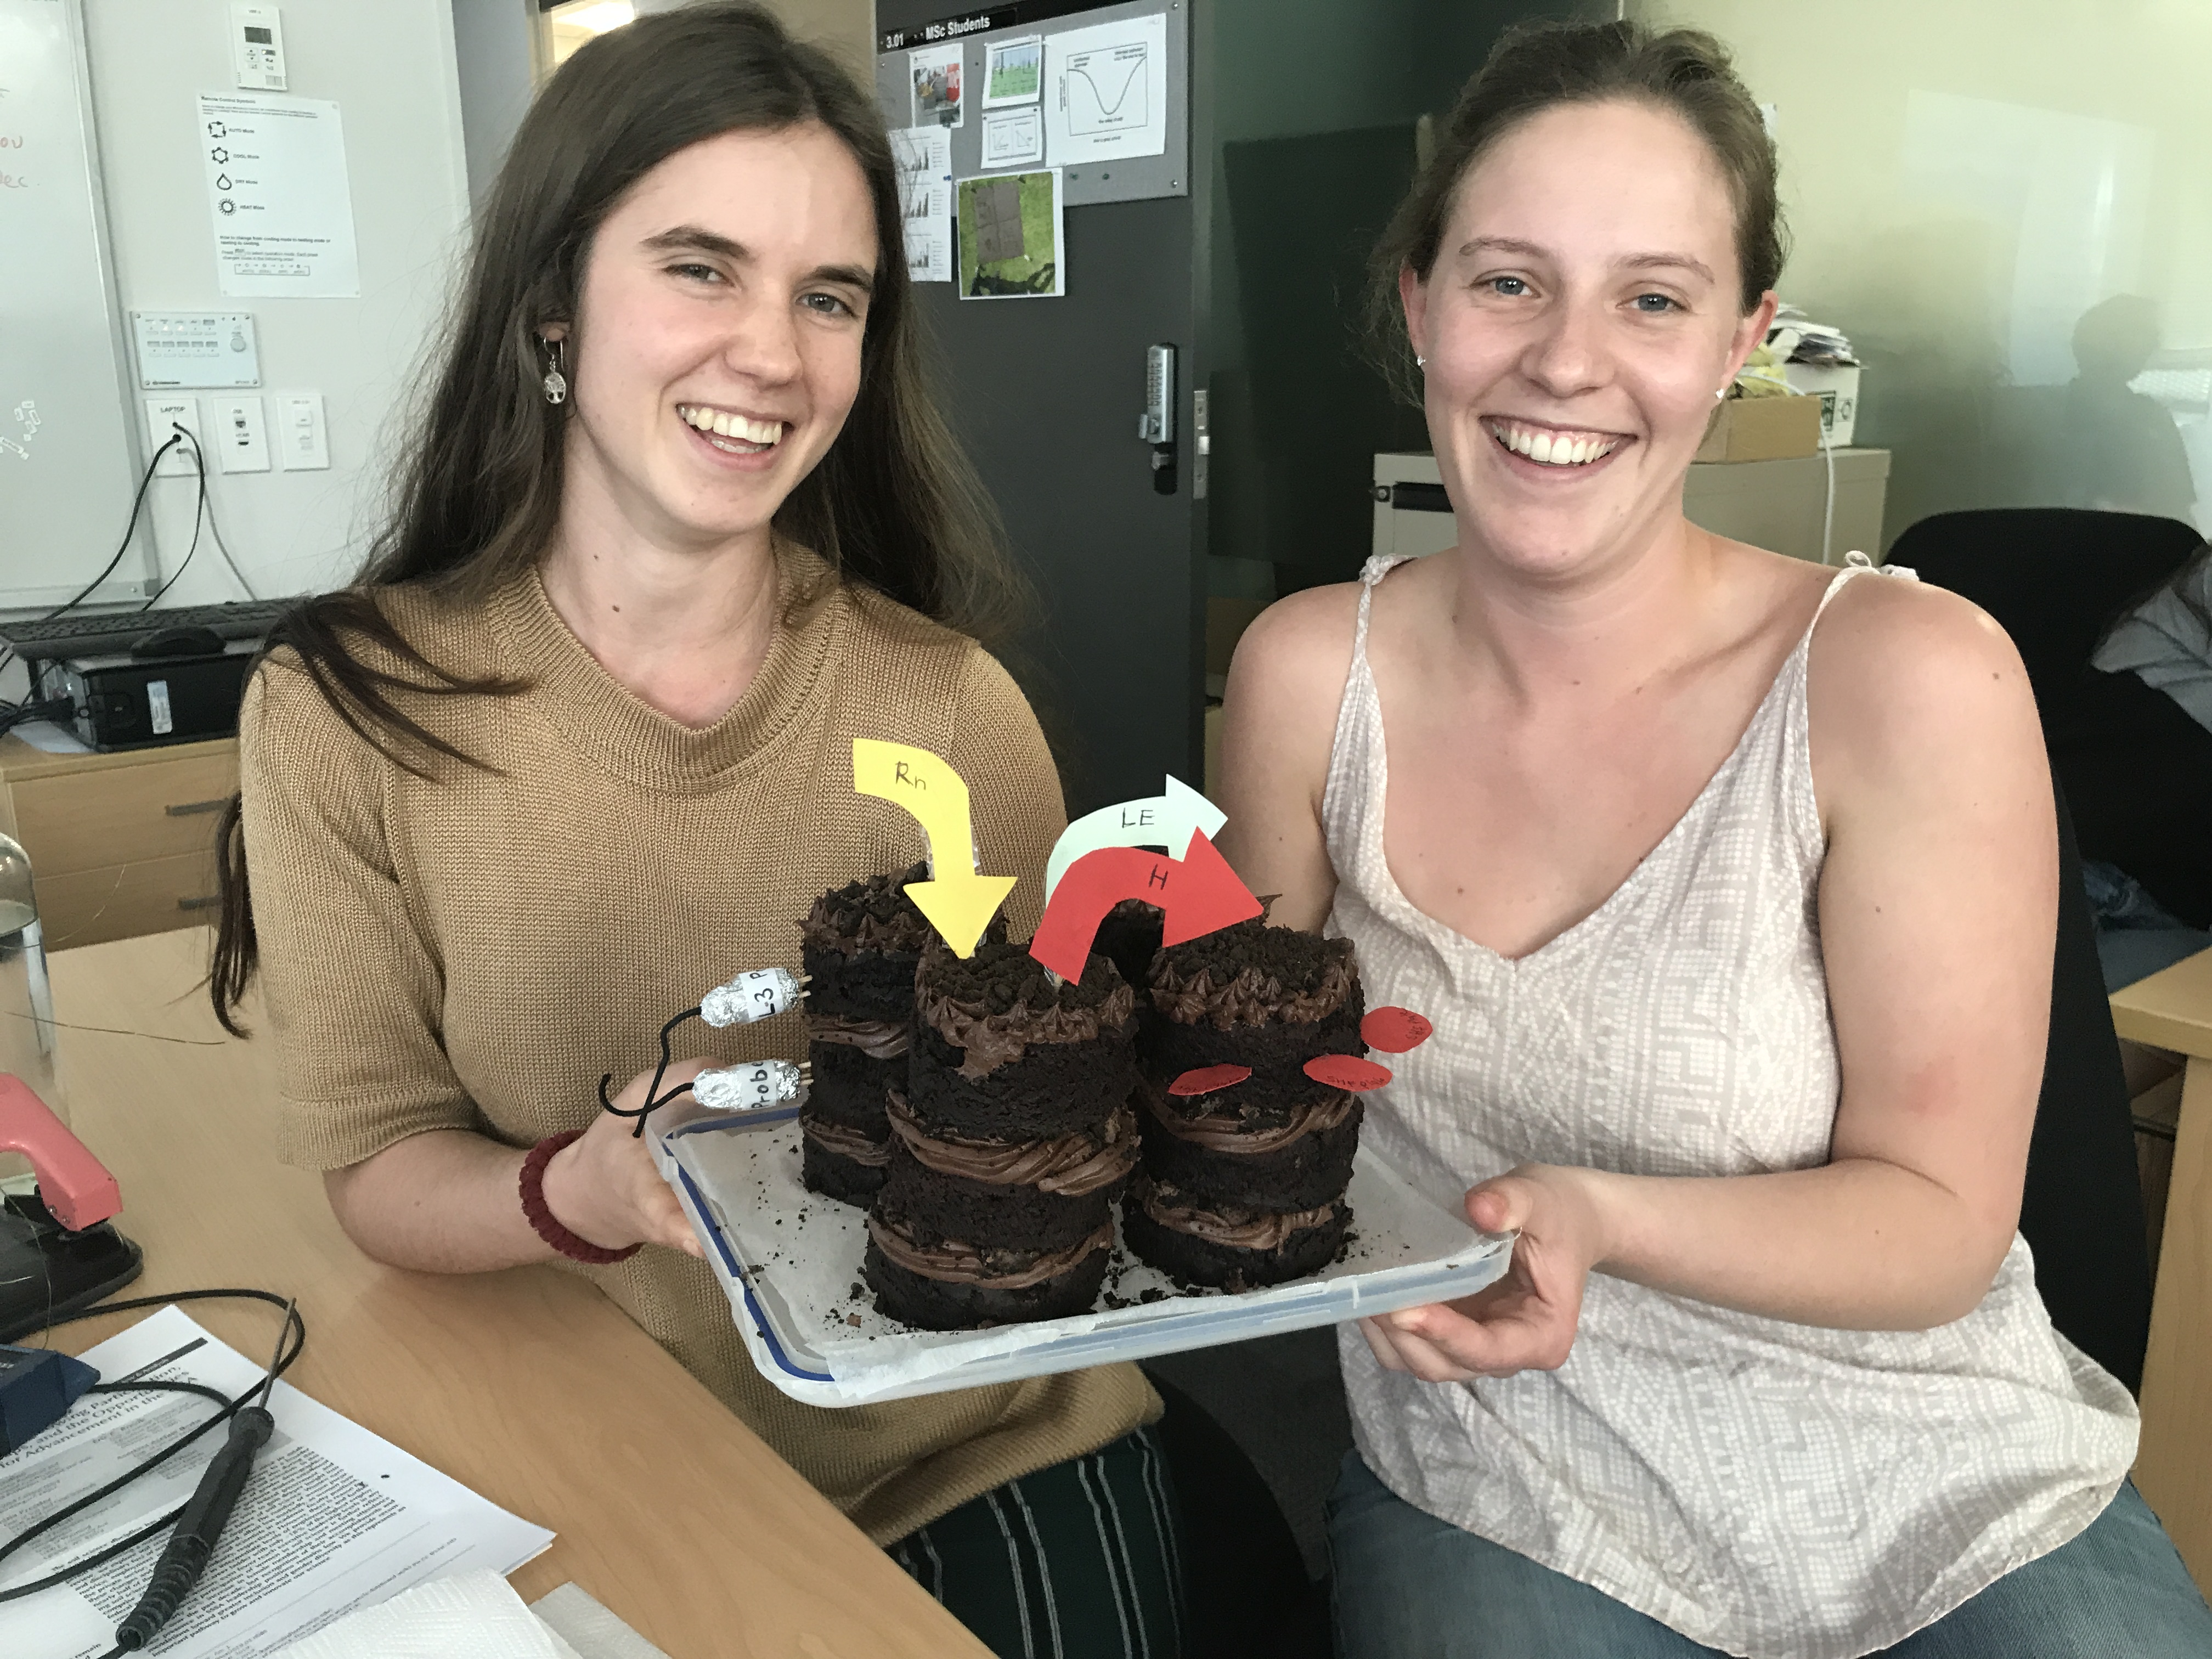
This combined research cake was based on Alice and Emily’s undergraduate research projects for the PEATWISE project (supervised by Dave Campbell). Alice (left) placed arrows on her cake to represent the energy fluxes received and released at the peat soil surface. Both PEATWISE sites position three soil heat flux plates at 8 cm depth which misrepresents the soil surface flux. Alice’s project aimed to improve the energy balance closure at the two PEATWISE sites by using soil physical properties of the peat at each site and data from the soil heat flux plates to calculate the soil heat flux surface value. This will be used in the wider PEATWISE project and incorporated into the standardised WaiBER soil heat flux calculation method.
Emily (right) modelled the ML3 soil moisture probes (not to scale) and inserted these into the cake to represent the placement of the probes at 5cm and 10cm below the surface at the study sites. The aim of Emily’s project was to increase the accuracy of volumetric soil moisture (VMC) data collected at Moanaleas and Gamma peatland Farms. The corrected data from this study has already been used in the PEATWISE project to help explain hydrological processes and the methods can be adapted to correct further data collected at these sites.
The cake was a vegan chocolate mudcake made to perfectly represent the texture of the peat and the recipe can be found on the minimalist baker website titled “1-Bowl Vegan Chocolate Cake”. https://minimalistbaker.com/one-bowl-vegan-chocolate-cake/
How do atmospheric climate systems drive the long-term changes in Antarctic soil climate?
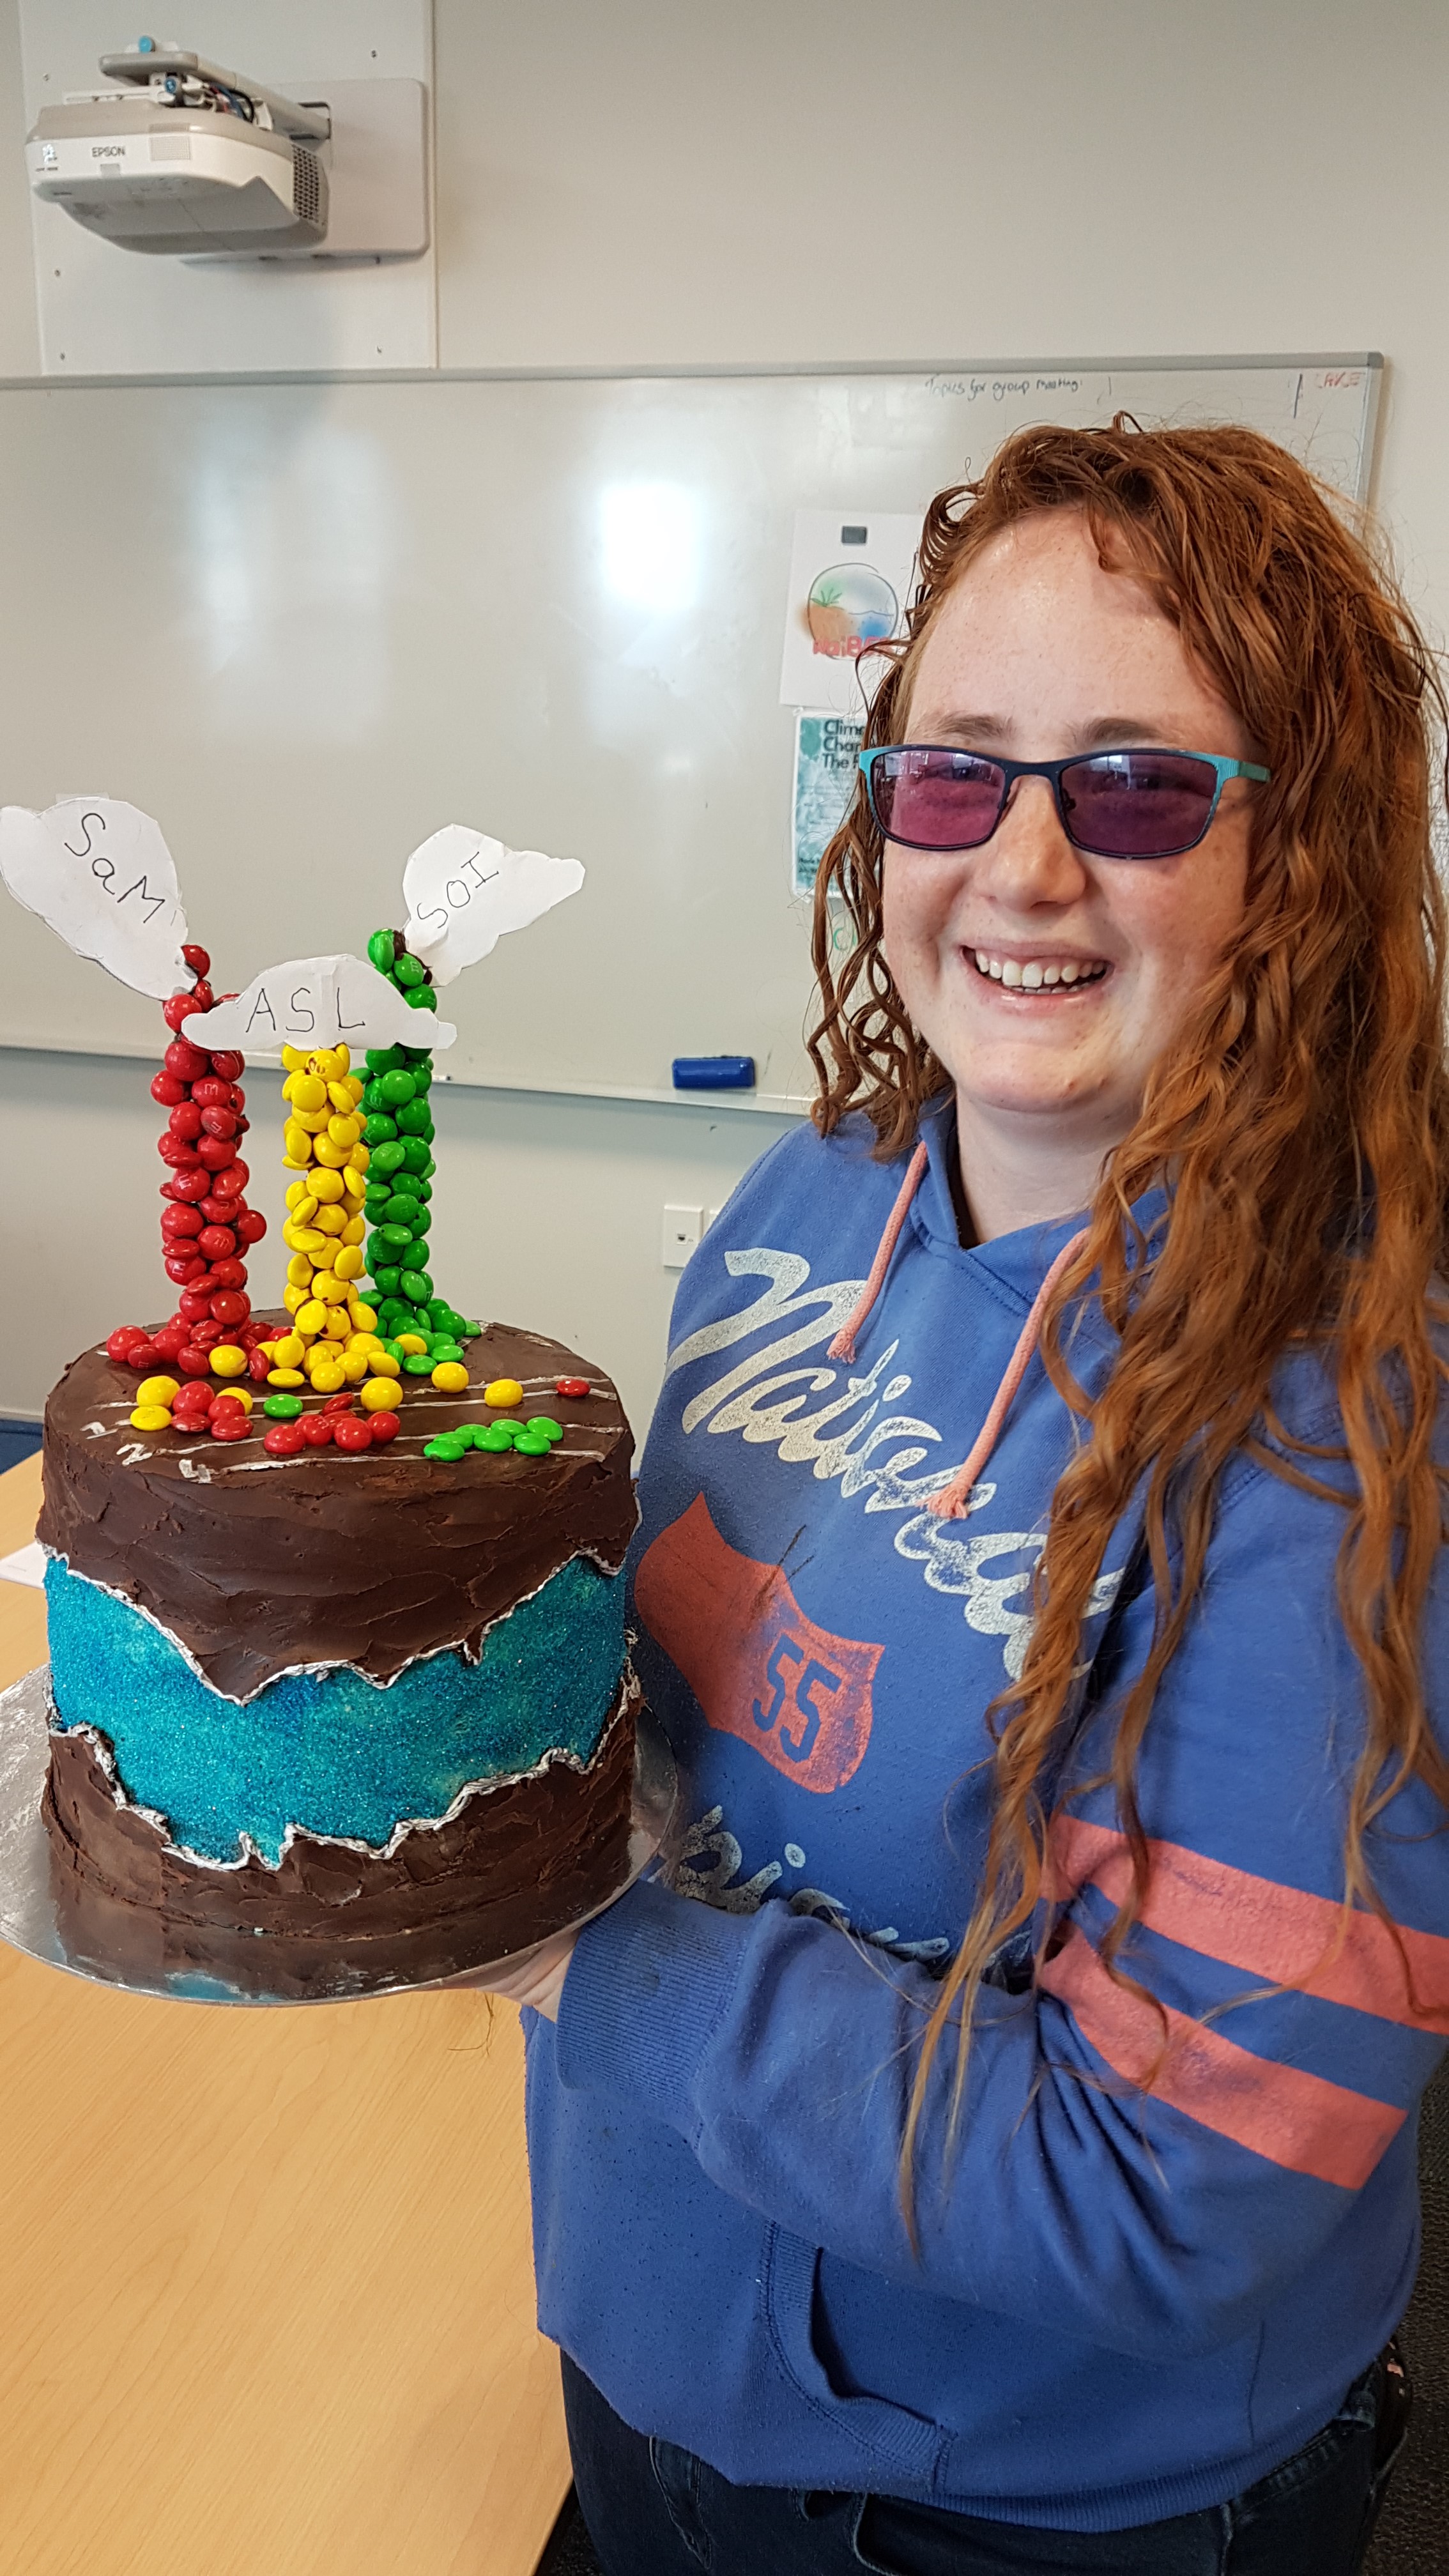
This cake presents the findings from the first part of Annette’s Master’s thesis. The fault line along the side of the cake portrays how the depth to the permafrost, and the temperature of the top of the permafrost, varies each year but no long-term trends are present. The top and bottom boundaries of the fault line have a different pattern to show that there was also variation between sites.
The top of the cake shows the three large scale climate systems (clouds) that are driving the variation in deseasonalised permafrost temperature (M &Ms flowing into the cake/soil). The yellow M&Ms show the Amundsen Sea Low (ASL) drive the permafrost on a 6 month – 1 year period, with significant events graphed. The Southern Annular Mode (SAM) has a 1 and a 2 -3 year period, while the Southern Oscillation Index (SOI) has both a 1 year and a 3 -4 year driving period. Previous research has shown that the SAM and SOI partly drive the ASL (depicted by the red and green M&Ms flowing through the ASL cloud).
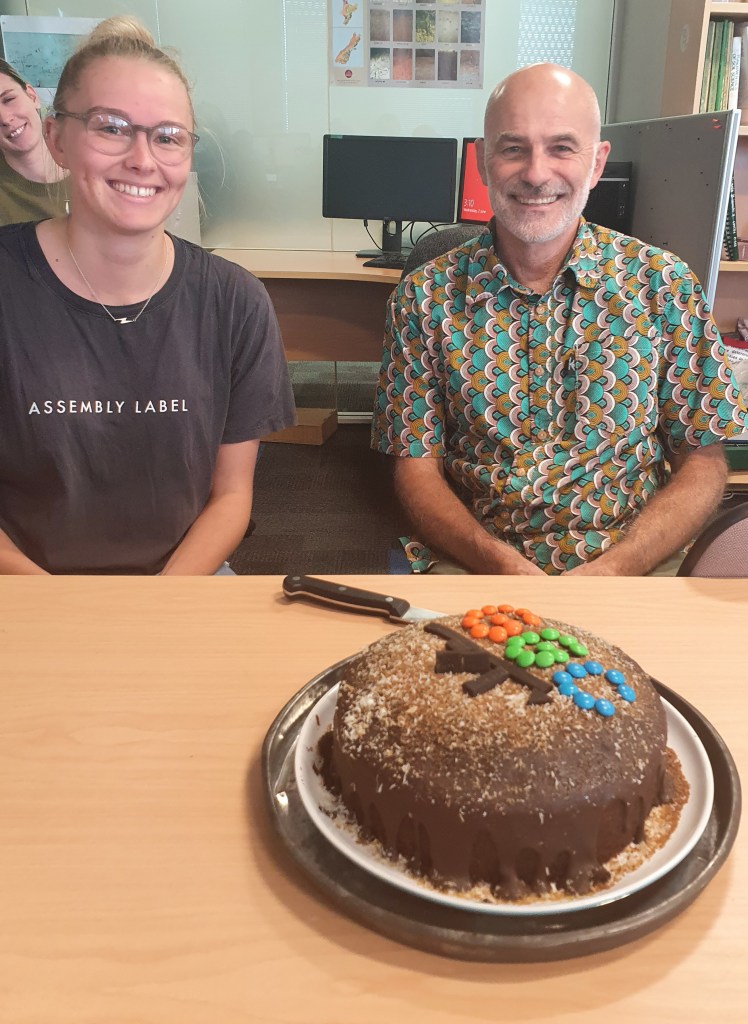
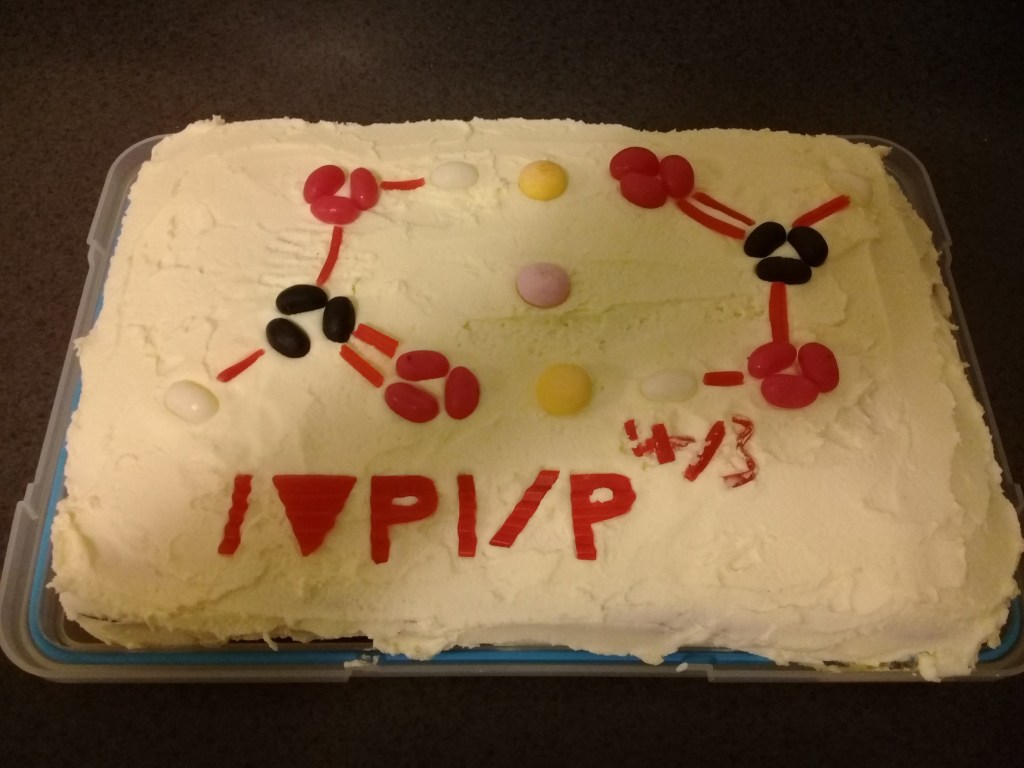
Nitrous oxide: chambers and eddy covariance
Anne’s cake illustrates a challenging task: the quantification of nitrous oxide (N2O) emissions from an intensively grazed New Zealand pasture. Dairy pastures are a mosaic (colourful lollies) of different emission sources: patches of cow urine (yellow) and dung (black); areas where the reactivation of old emission sources, soil compaction or the release of naturally fixed nitrogen lead to N2O emissions (orange); supplementary feed like maize silage that changes the nitrogen content of cow excreta (brown cubes); and nitrogen fertiliser (purple). Cake and research show that the quantification of single emission sources (assorted lollies) by using site-specific emission factors remained lower (3.82 kg N2O-N ha-1 yr-1) than suggested by eddy covariance measurements (7.3 kg N2O-N ha-1 yr-1). The difference between the two N2O budgets decreased when considering supplementary feed and background emission. Excitingly enough, the eddy covariance method performed well by taking into account the whole mosaic – year-round. Happy Tom in the background baked the cake as special support.
Does importing feed increase soil carbon of a dairy farm?
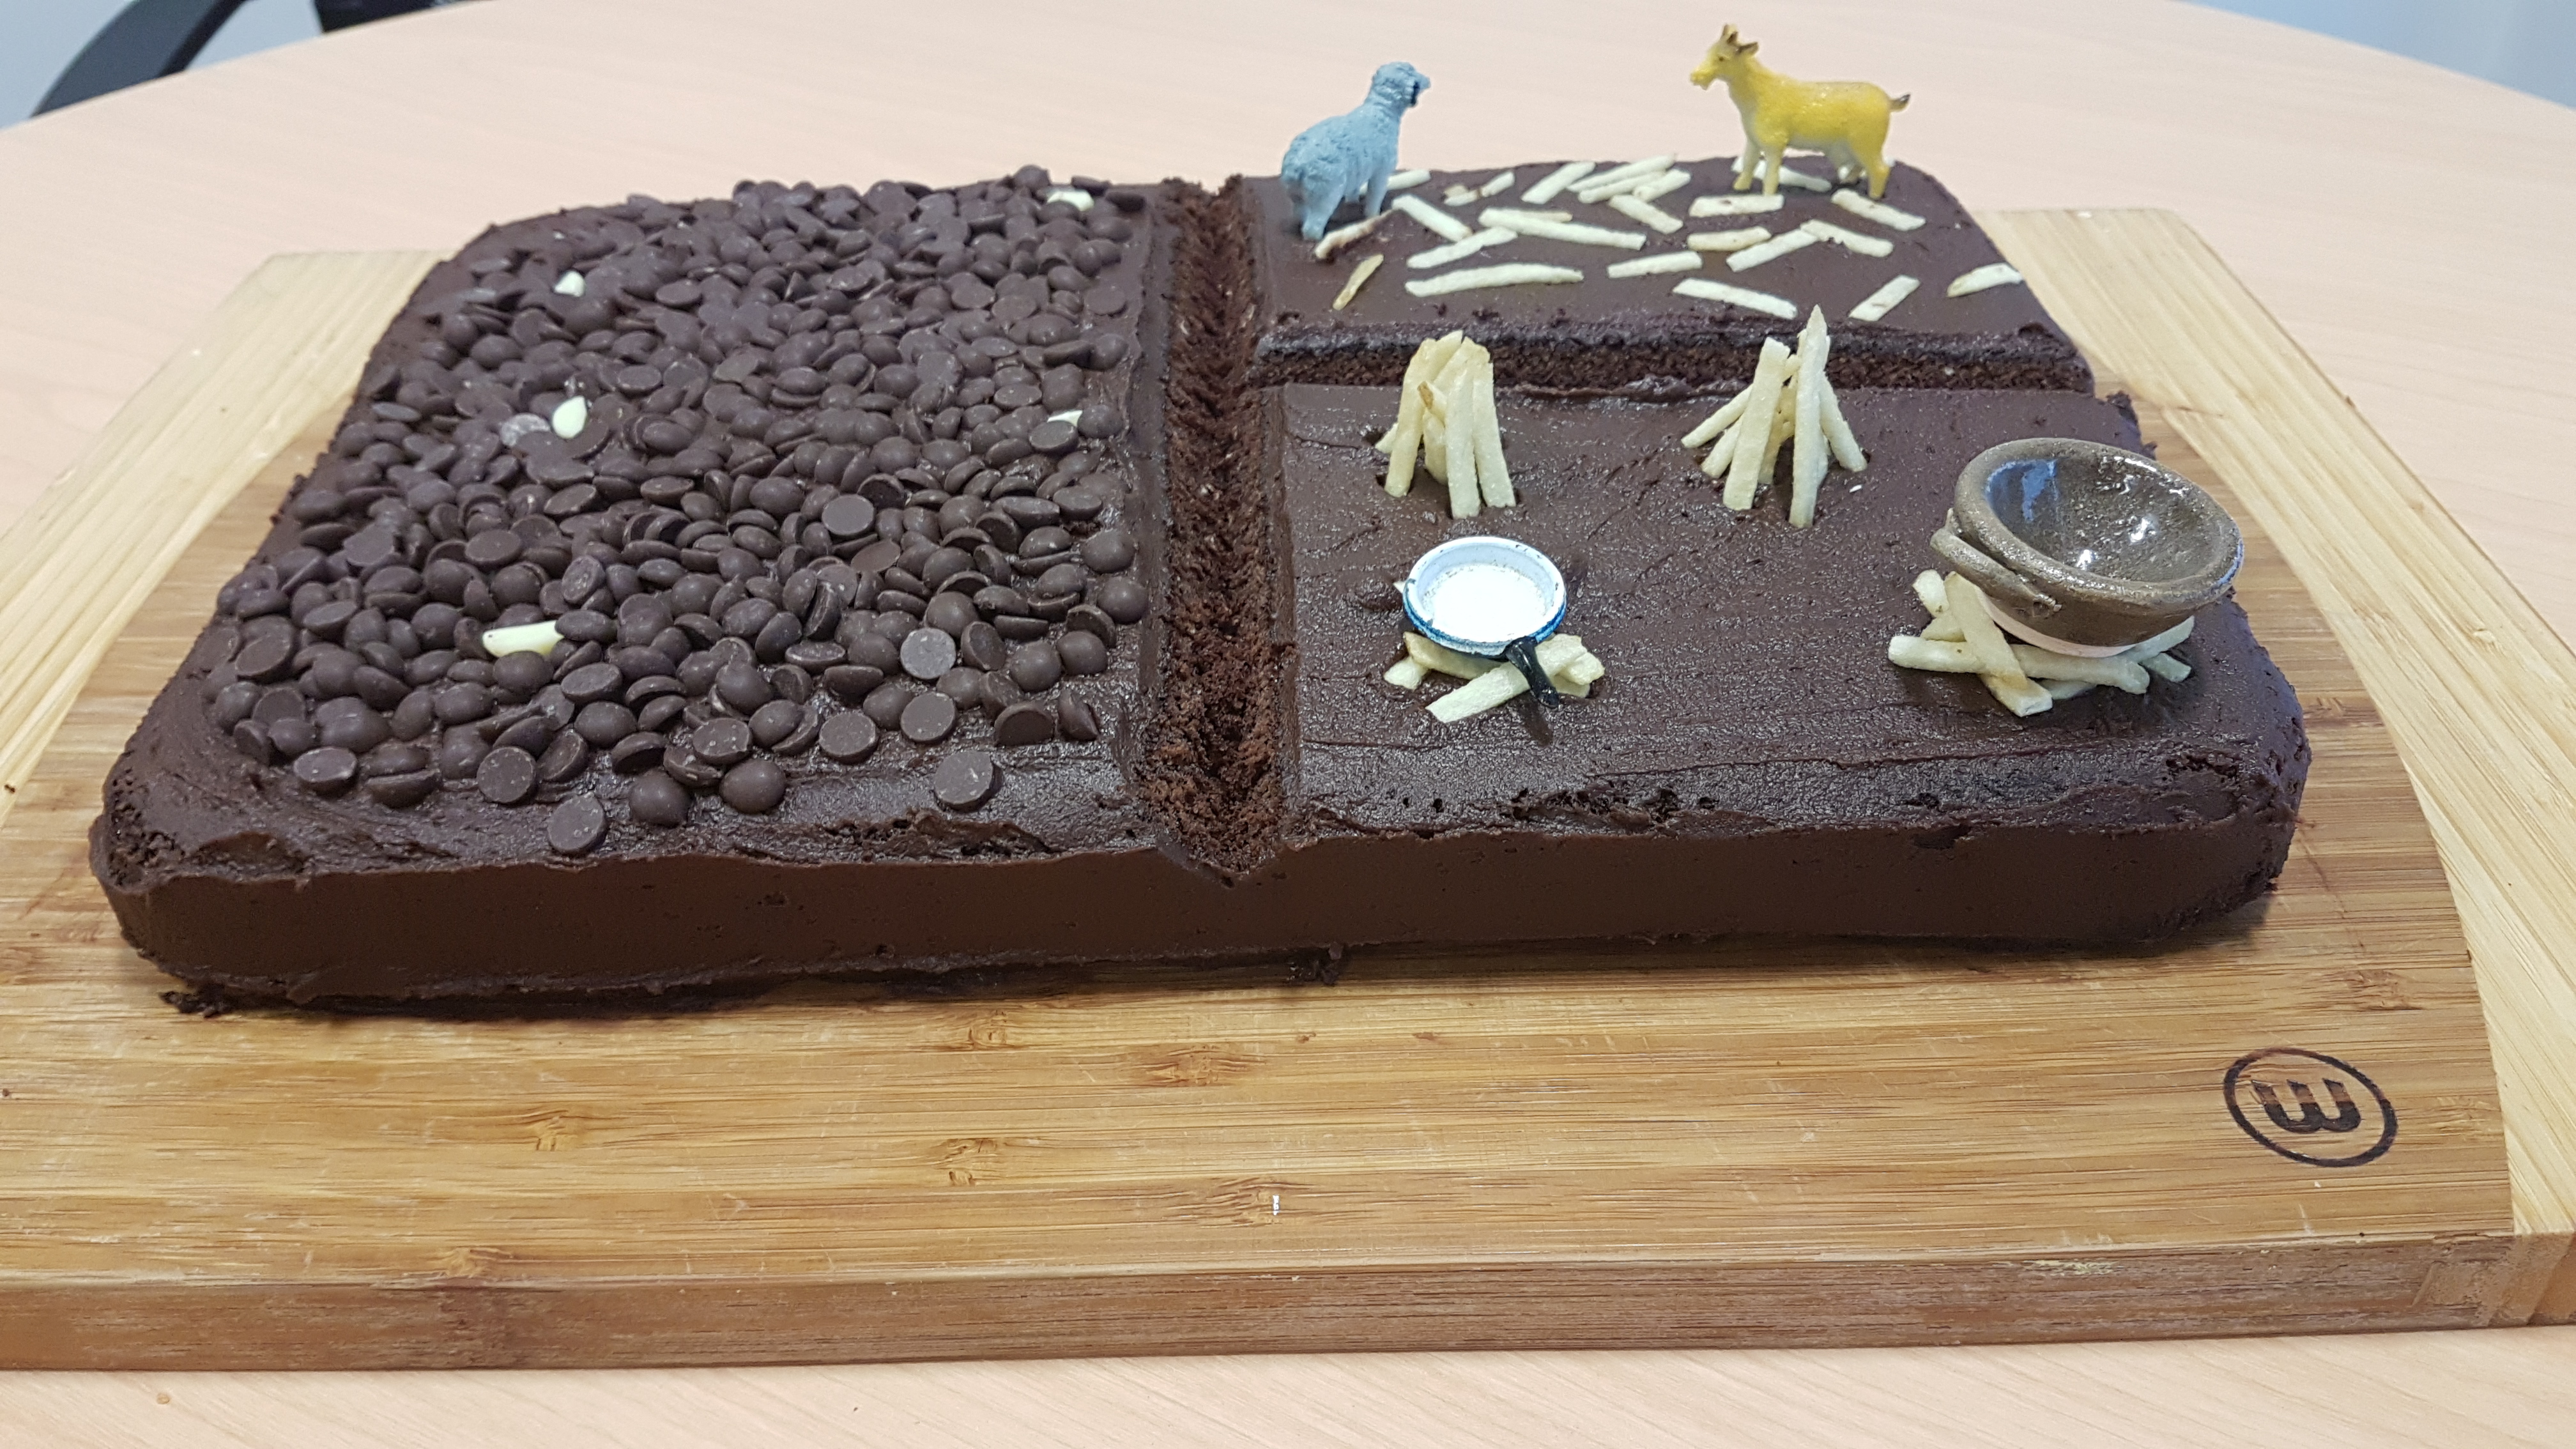
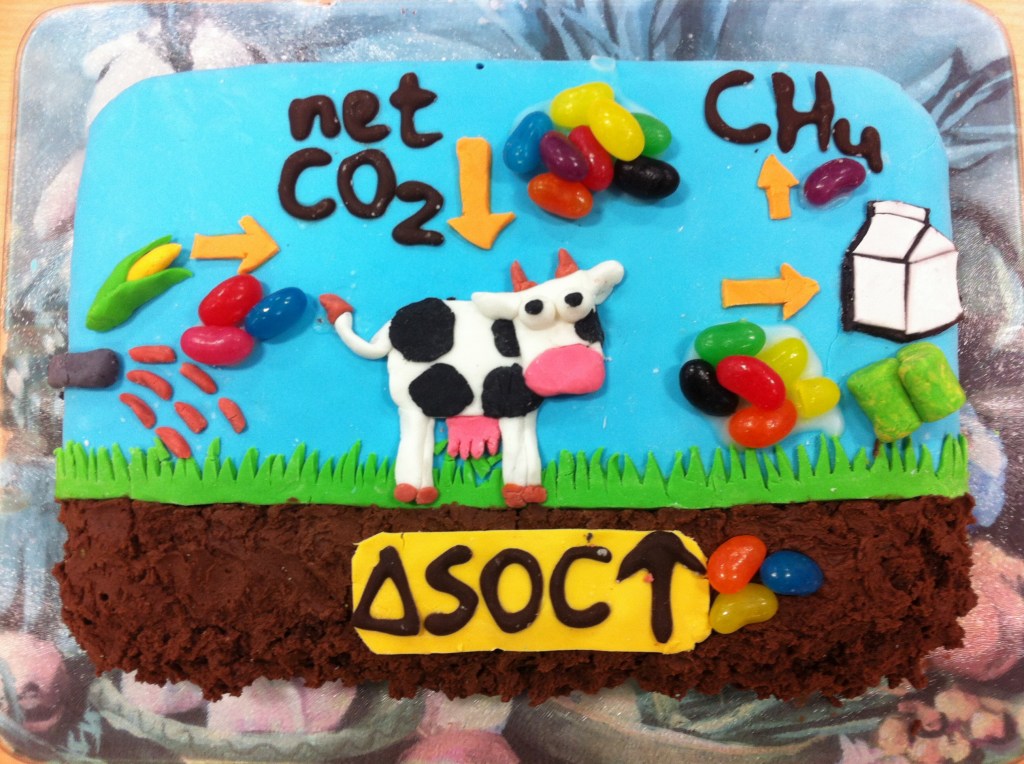
Aaron Wall’s cake summarises the key finding of our recently published paper titled “Carbon budget of an intensively grazed temperate grassland with large quantities of imported supplemental feed”. In our study, large amounts of supplemental feed (carbon) were imported to the dairy farm, but only a small amount was available for sequestration following consumption by the dairy cows. On the cake, the left hand side represents the imported supplemental feed (as a maize silage stack – one of the forms of imported feed). The liquorice rounds on silage stack represent the tyres common on the silage stack, and additionally each is equivalent to 50 g C m-2 of imported carbon. The right hand side represents both paddocks of the farm, and the three measurement years. The M&M’s within each “paddock” represent the C balance for the year (blue = 20; red = 10 and orange = 5 g C m-2). More subtle nuance is represented by the large size of the “silage stack”, and the small size of the M&M’s as large imports, small gains. Finally, the random distribution of the M&M’s is representative of the mechanism in which supplemental feed C is sequestered – through transfer of dung from off paddock consumption to random deposition of excreta by the cows
Removal of bacteria, viruses and ammonium in bioreactors

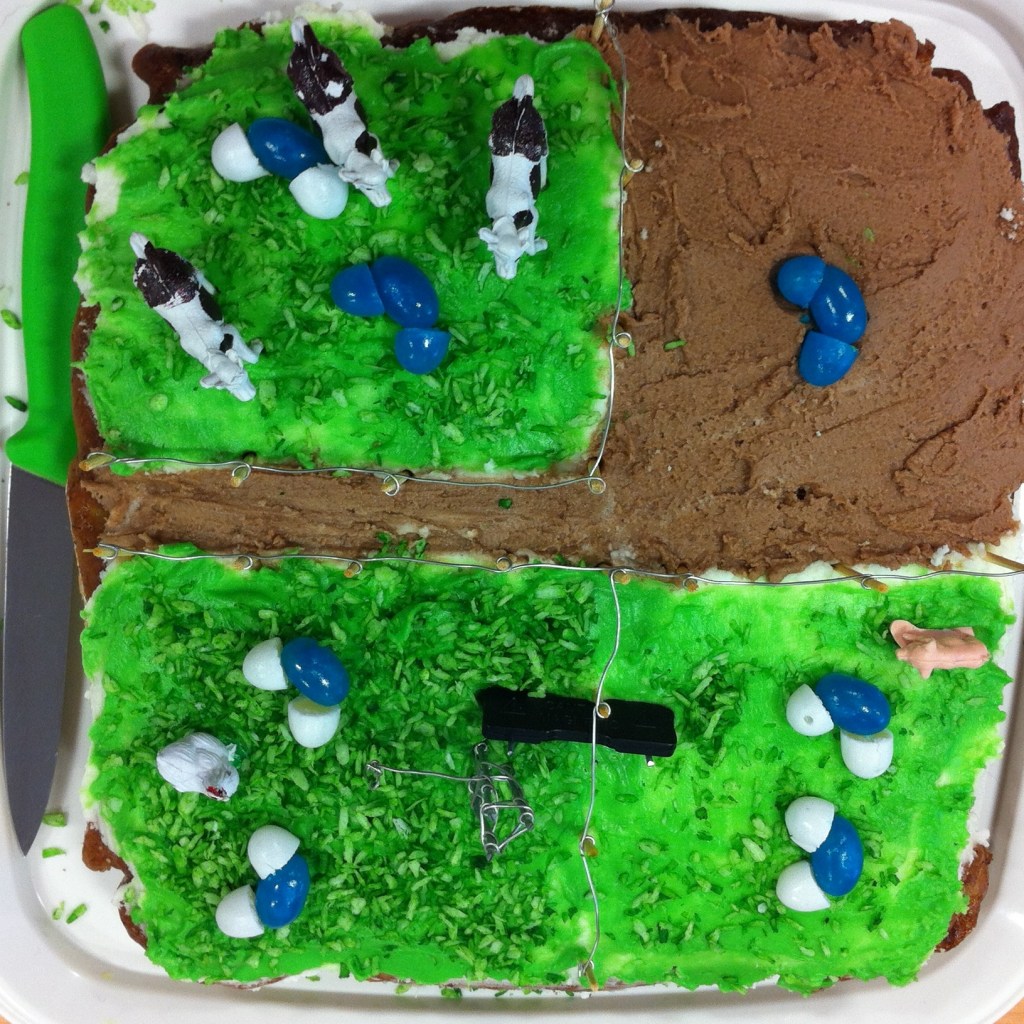
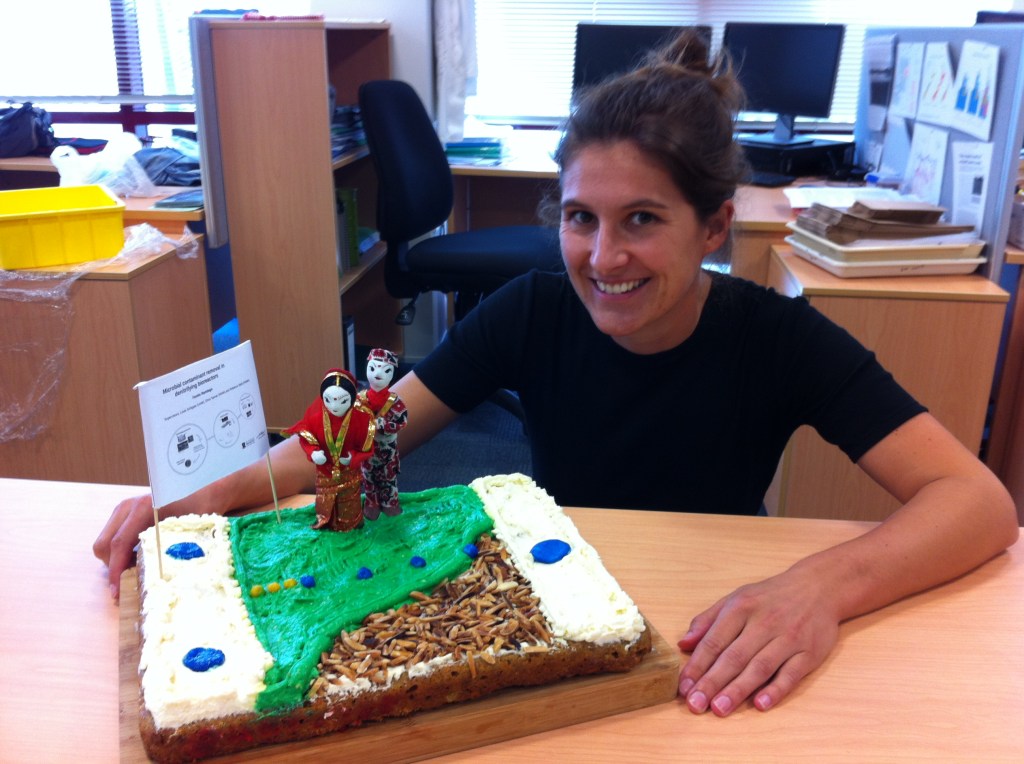
Femke Rambags completed her PhD thesis which was captured on this cake. It represents her research which focused on the removal of microbial contaminants and alternative nitrogen removal pathways in denitrifying bioreactors The cake has 5 toppings which represent the different media that was tested, on the right you can see bacteria and viruses (jellybeans and flowers) going into the bioreactor and on the front side you can see ammonium and nitrate molecules, which were converted to nitrogen gas by denitrification and anammox.
Otakairangi wetland study
Callum Douglas completed his MSc thesis captured on his researchcake that depicts the vegetation cover across Otakairangi wetland, Northland, which is bisected by a larger drain (blue M&M’s). The marginal swamp belts (which receive nutrients from floodwaters) is characterised by larger vegetation species (flake and chocolate icing). The inner wetland areas (green icing) is mainly dominated by Tangle fern, with the primary peat forming species Empodisma robustum being dispersed primarily on the north side of the drain (yellow M&M’s). The adjacent pot plant is a young Empodisma. To promote recovery of this important wetland, Callum has suggested transplant of Empodisma from the north to the south.
Drainage of peat alters carbon uptake
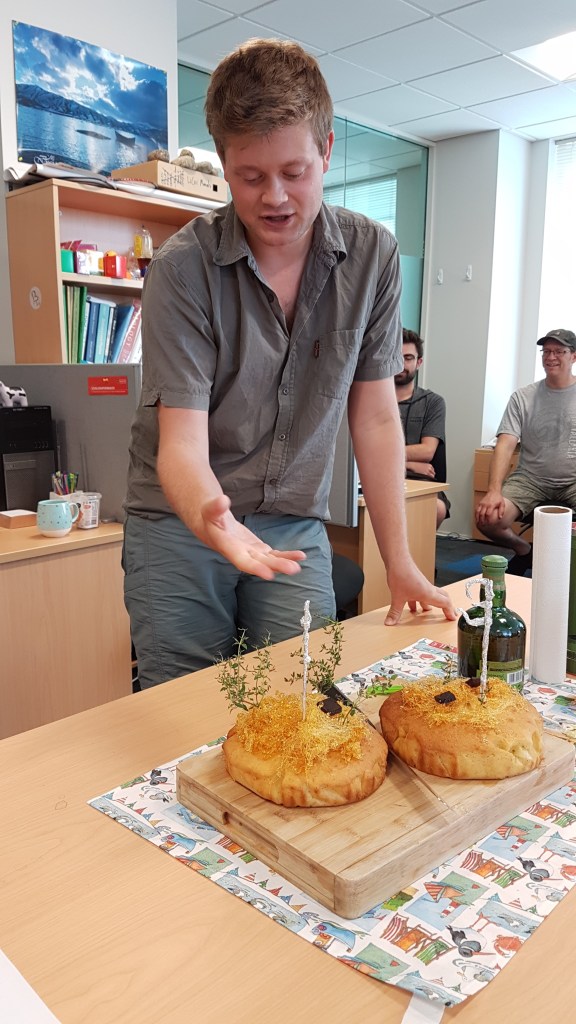
These cakes summarise a paper by Ratcliffe et al., 2019. Each cake represents a peat bog, with the cake on the left representing Moanatuatua, a peatland deeply drained and the cake on the right representing Kopuatai, an undrained intact peat bog. The cakes were decorated with spun sugar to represent the dominant vegetation Empodisma robustum (wire rush) while the sprigs of Thyme represented the woody shrub Epacris pauciflora. Vegetation at Moanatuatua (left) was taller, and E. pauciflora more abundant reflected by the greater amount of spun sugar and Thyme used. The silver towers represent the Eddy Covariance stations measuring CO2 exchange, with chocolate pieces representing CO2 uptake from the atmosphere with one lump at Moanatuatua representing 69 g C m−2 yr−1 and two lumps at Kopuatai representing 203 g C m−2 yr−1 . Finally to add an authentic peaty aspect to the research cakes a peated whisky was used (Connemara, Kilbegan Distillary, Ireland) to souse each cake. Kopuatai, being the wetter of the two, receiving a more liberal sousing and was slightly more popular.
Modelling non-covalent interaction
Daniel Schipper developed a computer model during a summer research project that allowed calculation of regions of non-covalent interactions between molecules helping understand their chemical properties. The example cake is of bonding between adjacent formic acid monomers, represented by liquorices and jelly beans. The Mentos represents regions of non-covalent bonding defined by region where both the electron density and the reduced density gradient is lower than a cut-off value. Colour of the Mentos describes whether the region is attractive (yellow) or repulsive (purple).
Losses of soil C and N from pastures under irrigation
This research cake was based on Jamie Millar’s Masters thesis. The cake depicts an area of a paddock that is pivot irrigated (semi-circular wheel tracks in brown chocolate) and an adjacent non-irrigated portion of the paddock. The toothpicks show the soil sampling areas. There was a net loss of soil carbon of -5.9 t C/ha and nitrogen of -0.2 tN/ha under irrigation of these Pumice Soils. The cake was sponge representing the Pumice Soil profile with a layer of lemon curd for ash (and other Taupo eruptive events). The A horizon was made from crushed Oreos and iced with butter icing.
Nitrous oxide emissions from Brassicas and ryegrass

This is the researchcake Sheree Balvert produced on completion of her PhD thesis. It represents her feeling that she came out with more questions than answers… a rather a common experience for PhD students! The cake is split in 2 halves where nitrous oxide emissions (crispy noodles) from two forage types (green coconut vs spearmint leaves representing ryegrass/clover and brassicas) are compared.
Temperature dependence of soil respiration
This research cake was created by Jasmine Robinson to represent her MSc thesis and subsequent paper on the temperature dependence of soil respiration. For her thesis she used a large aluminium block, heated at one end and cooled at the other, to incubate soils and measure respired CO2 along a stable temperature gradient (~2 – 50°C). Her cake was made using 6 delicious chocolate cakes, chocolate buttercream icing and a truck load of fondant! Also green jelly coolant. Check out the paper:
Plus and minus
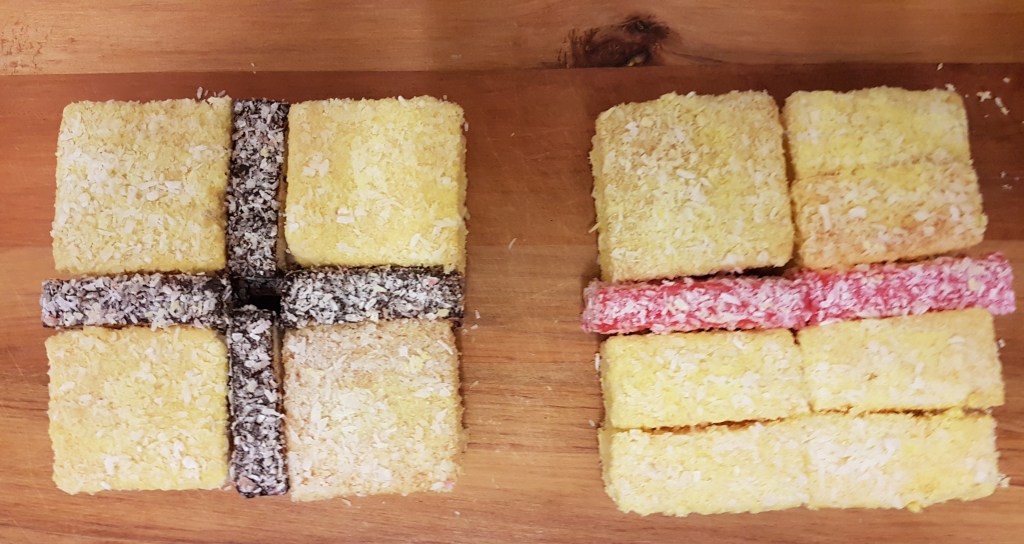
Louis wrote a letter to the editor expressing some concerns about a paper published in Global Change Biology that examined changes in soil carbon stocks following deforestation. The authors of the original paper responded with their views. A critical component of research and development of ideas is the debate. This #Researchcake recognises that there are arguments for (pluses) and against (minuses) all ideas, particularly new ideas, and there is great value in the discussion. It is important to understand that these debates are not personal but trying to advance our understanding. P.S. this is possibly the laziest researchcake made from store-bought Lamingtons.
Cadmium crossword – 3 papers in 1 PhD

This cake represents my PhD research key words! Cadmium is a toxic metal mainly originating from phosphate fertilisers application in NZ agricultural lands. I assessed the behaviour of Cd in contrasting soils(including Horotiu, Bruntwood, Te Kowhai) with the same fertiliser history. The results showed that there was no significant difference between the distribution of Cd of these soils and therefore Cd distribution was more related to the amount of fertiliser added. I also employed an isotope technique to trace the sources of Cd in NZ soils, which helps to be able to manage Cd in NZ soils and receiving environment. Finally, I showed that irrigation of pastures induced a ∼7% Cd loss from topsoil (0–0.1 m), suggesting irrigation might partially enhance Cd mobilization, but Cd is still mainly adsorbed to soil surfaces.
Globally convergent leaf respiration?
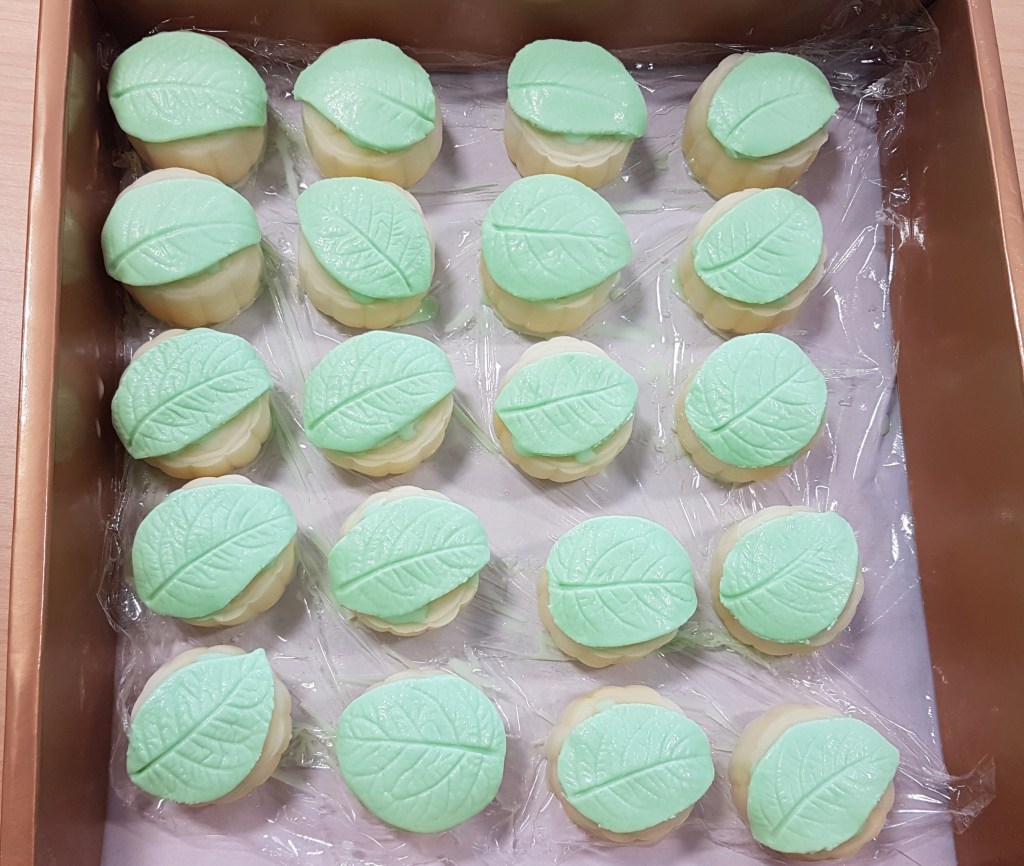
This research cake by Liyin represents a publication of the temperature response of leaf respiration rates from around the globe. The Chinese mooncakes that sit under each leaf are round mitochondria that power respiration. Inside the mitochondria, the high concentration of proteins (solid custard made by mike powder and eggs) are the enzymes that regulate leaf respiration. The cakes are identical in appearance because we showed very similar thermodynamic properties of the collective enzymes that drive leaf respiration around the globe whether collected from the arctic or the tropics. http://onlinelibrary.wiley.com/doi/10.1111/gcb.13936/full
Reducing nitrous oxide emissions
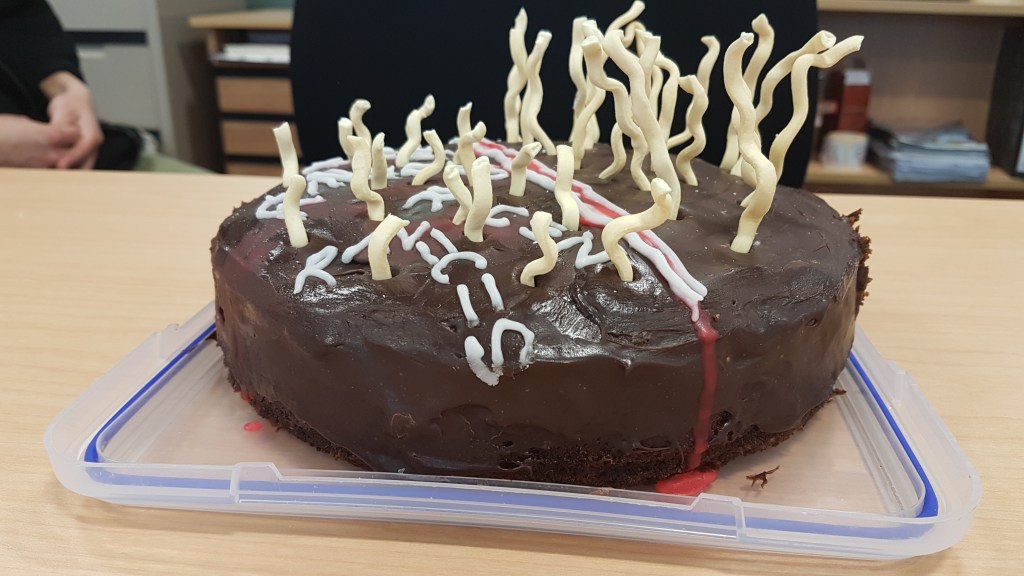
Sheree’s cake summarises a recent published paper from her PhD looking at whether secondary metabolites found in brassica crops can decrease nitrous oxide emissions from cow urine applied to soils. Nitrous oxide is a potent greenhouse gas and there is a great deal of interest in finding ways to decrease these emissions.
The left of the cake represents soil amended with these secondary metabolites (glucosinolate hydrolysis products) where the molecular structures of some of the compounds are drawn with white icing, and the right side is control soil. The length of the vertical noodles represent the nitrous oxide emissions measured from each treatment, short noodles = lower emissions (not to scale). So, overall my laboratory study identified some plant derived compounds that have promise for reducing greenhouse gas emissions from agriculture.
Temperature monitoring in Antarctica

This cake shows the measurement of climate data in the Wright Valley, Antarctica and forms the basis of Annette Carshalton’s Masters thesis. The grey poles represent 5 climate stations distributed up the valley. The red piping under each tower represents the temperature fluctuations. Annual summer temperature is portrayed by the size of each of the climate towers (smaller being colder). As expected there was an attitudinal trend with colder temperatures on Mt Flemming compared to the temperatures see in the bottom of the Wright Valley on the coast.
4 parts per thousand
New research cake summarising a recent commentary in Nature Climate Change on the 4 per mille initiative. This initiative encourages carbon storage in soil to offset greenhouse gas emissions.
On the left is what 4 per mille looks like: the dark chocolate buttons are soil C and the white buttons are the 4 per mille accumulation, actually it is about two/three years accumulation (hard to weigh out such small amounts). On the lower right is some competing use of residues which are needed to increase soil carbon – fuel for cooking or construction of shelter. Above right is incorporation of residues in soil – hopefully improving soil quality and supporting potentially production.
Paper is here: http://www.nature.com/…/journal/v7/n5/full/nclimate3286.html
What does irrigation do to microbial respiration?
Previous research showed that irrigated grazed pastures had less carbon than adjacent non-irrigated soils but the reason for these differences was not known. This cake represents Olivia Petrie master’s research that investigated the temperature and moisture sensitivity of microbial respiration in irrigated and non-irrigated soils. There were two halves to the cake: the lighter side is buttercake and represents the non-irrigated soil which was generally lighter in colour due to a lower moisture content and the darker side is chocolate cake which represents the irrigated soil which was darker due to higher moisture content. Olivia found that respiration in irrigated soil had a lower overall respiration rate but higher temperature optimum than non-irrigated soil. One possible reason for this was a change in microbial community composition which is represented in this cake by the different sprinkles on each treatment.
Twin papers on carbon storage
This cake summarises two papers that tried to find out if converting our traditional ryegrass/clover pastures to more diverse pasture swards could increase soil carbon. Each column represents a different treatment applied at the Troughton farm and rows are years. The right column is a control that was under ryegrass clover throughout the three years. The middle column was initially normal pasture, sprayed off (middle row), and renewed back to ryegrass clover. The left column is normal pasture, sprayed off and converted to diverse pastures (including species like plantain and chicory). M&Ms on each square are worth 250 kg of carbon per hectare and show how carbon stocks changes through the three year study. In the end, converting to diverse swards maintained carbon better than converting back to ryegrass clover. One of the reasons for increased soil carbon storage is greater root inputs of carbon which is shown on the side of the cake.
http://www.sciencedirect.com/science/article/pii/S0167880917300154
http://www.sciencedirect.com/science/article/pii/S0167880917300580
Mer Bleue
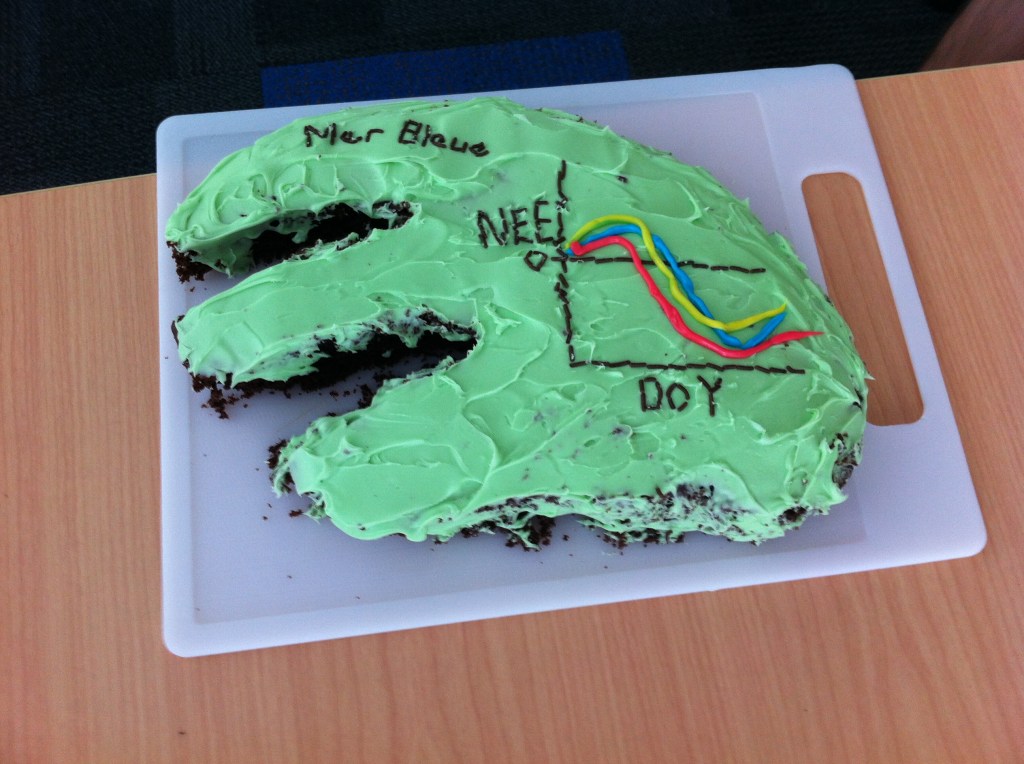
Peter Lafleur is visiting and made a research cake to eat before his presentation. The cake depicts the shape of the iconic Mer Bleue peat bog, which has been studied for nearly 2 decades with a focus on the exchange of carbon between the atmosphere and the bog. Globally peatlands generally slowly accumulate carbon with time and this is shown on the cake: NEE stands for net ecosystem exchange and DOY is day of year. The three coloured lines are different years and show that the amount of stored carbon varies between years and the reasons for this variability are not really understood but Peter is on the case!
Soil mapping
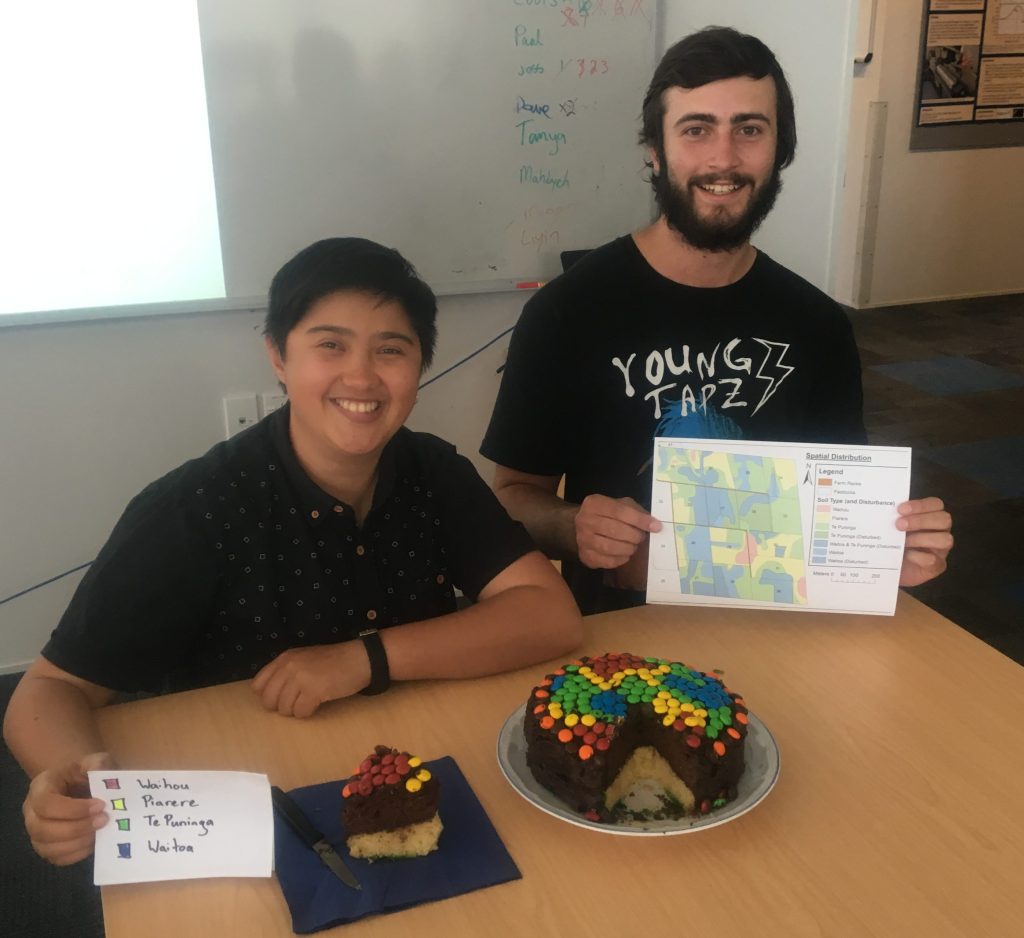
Our summer BSc(tech) students, CJ and Liam have spent the 3 months with us mapping the soils at our research farm. CJ made a wonderful, two layer (A and B horizons) cake using M&Ms to position soils in the landscape. CJ is holding the legend to make sure we remember which soil is which. Meanwhile, Liam has the generated soil map of the site. They also measured a wide range of different soils properties that will be very valuable in our future work.
Team Orcman
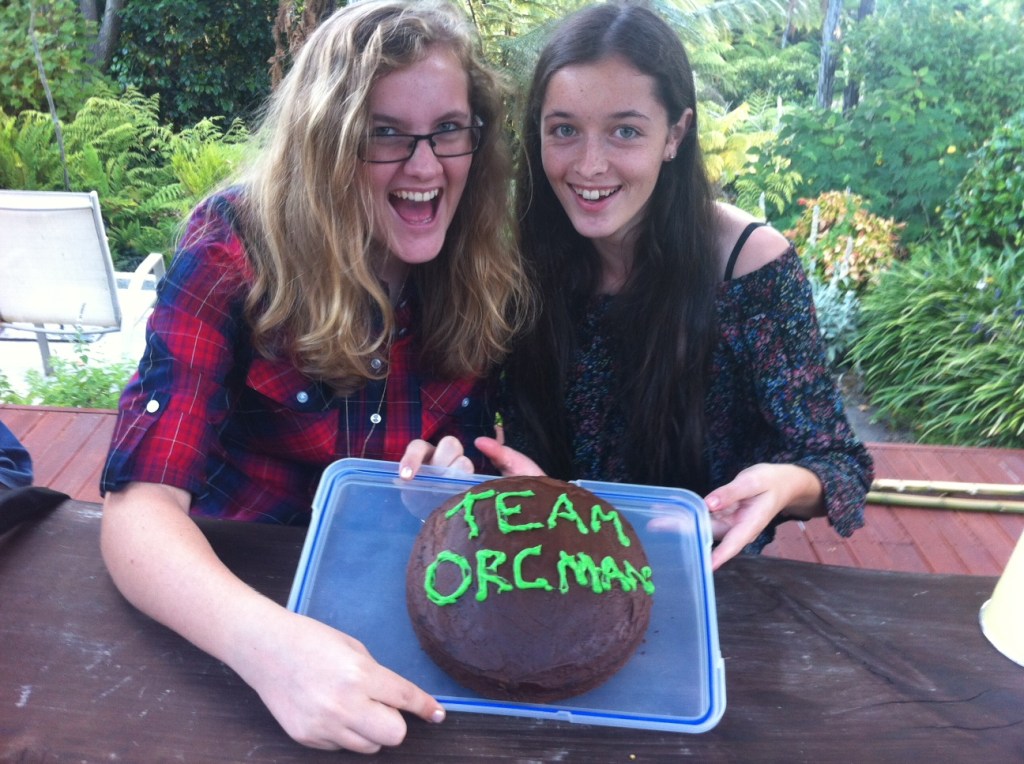
How many scientists started playing Dungeons and Dragons? Meet two members of Team Orcman.
Norman Taylor Lecturer
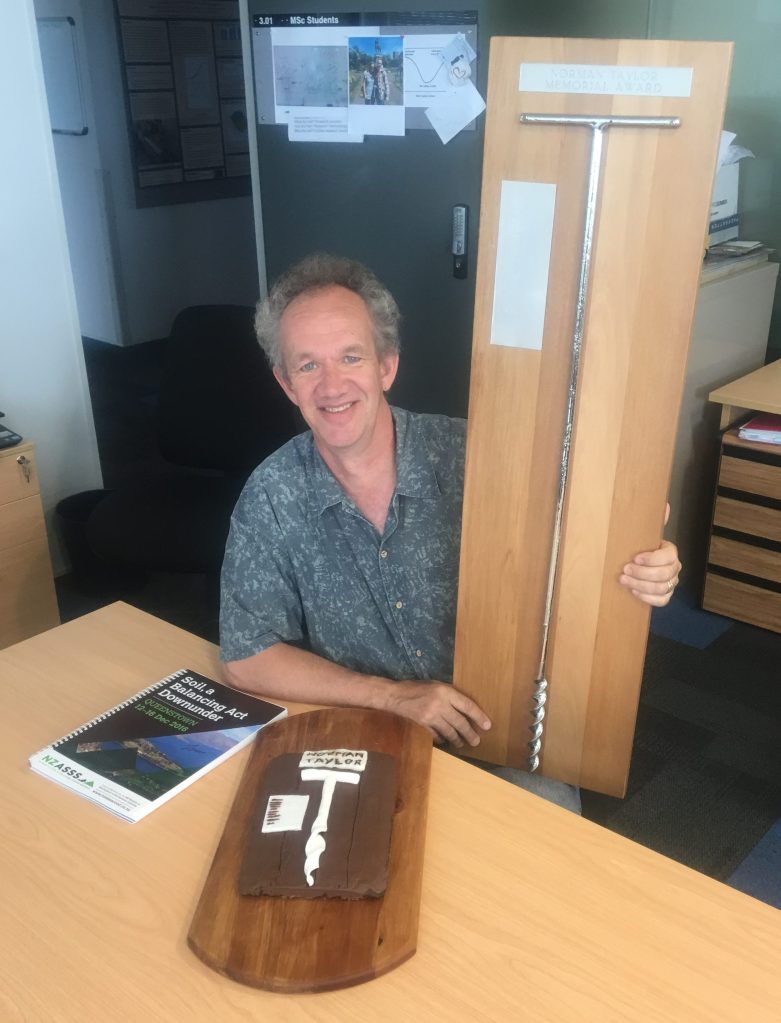
Last year at the joint annual conference of the New Zealand and Australia Societies of Soil Science, Louis gave the Norman Taylor lecture titled: “Carbon, nitrogen, energy storage in organic matter of pasture soils – and cake“. Louis is pictured with the physical award – Norman Taylor‘s auger which has been silver plated and mounted on wooden board. Louis made a cake loosely depicting the award.
Celebrating Soil
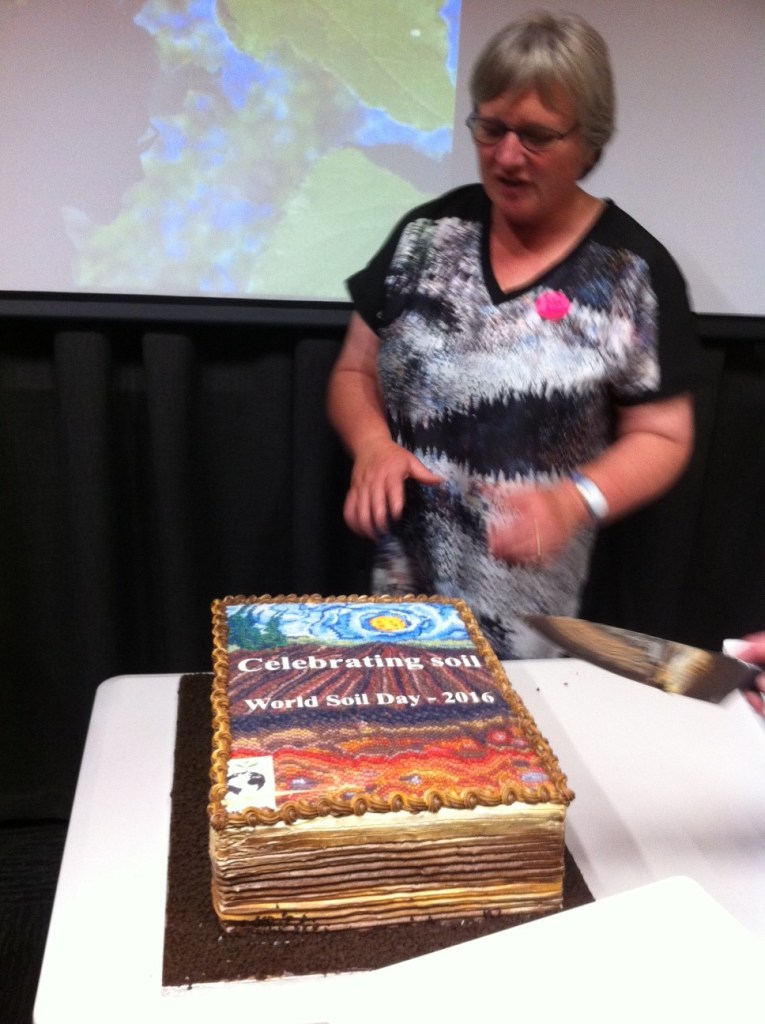
A cake to celebrate the launch of a book by Megan Balks and her friend Darlene Zabowski – “Celebrating Soil: Discovering Soils and Landscapes” and also in recognition of World Soils Day.
Root inputs following herbicide
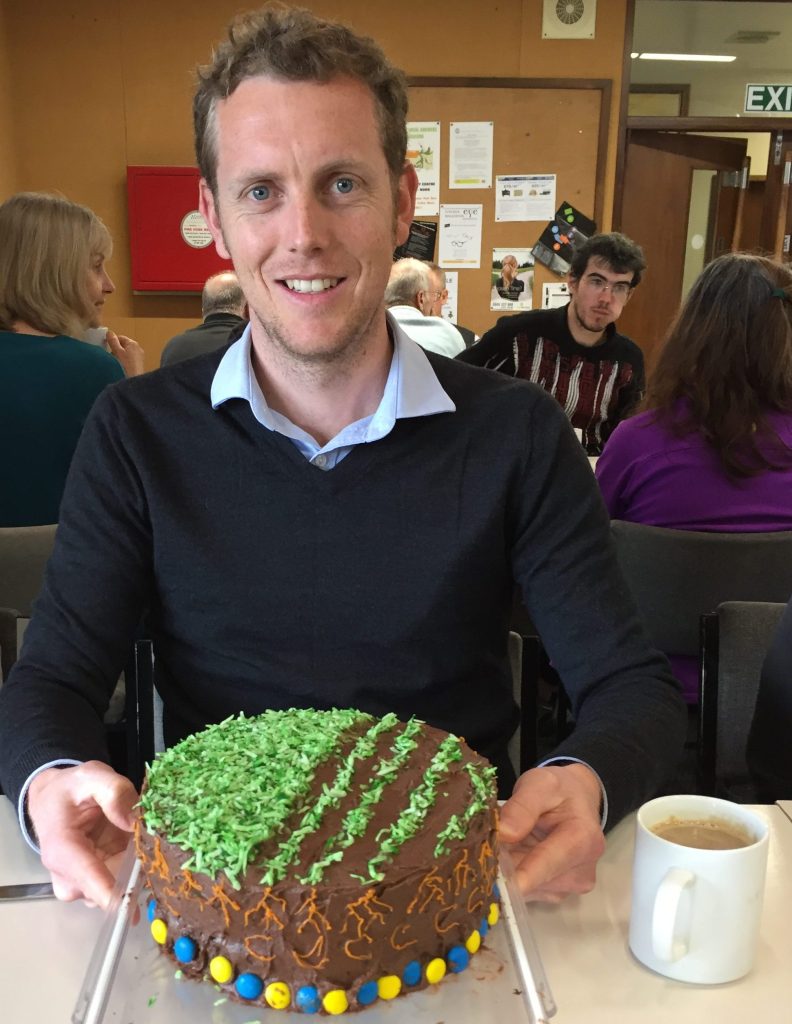
Sam published his second paper from his PhD and despite now working in the South Island, sent us a photo. The cake shows herbicide sprayed, and then regrassed, pasture (on right) vs non sprayed pasture(on left). Roots are shown on side of cake and the amount of carbon input into the soil following spraying depicted with M&Ms around the base. Spraying roughly doubled carbon inputs to soils and so there are about twice as many M&Ms under the regrassed side. Increasing carbon inputs to soil and its stabilisation is critical for removing carbon dioxide from the atmosphere.
McNally, S.R.; Laughlin, D.C.; Rutledge, S.; Dodd, M.B.; Six, J.; Schipper, L.A. (in press) Herbicide application during pasture renewal increases root turnover and carbon input to soil in perennial ryegrass and white clover pasture. Plant and Soil.
Evaporation from pastures
Jack published a paper that measured evaporation rates from three sets of paddocks at the Troughton farm. He found very little variation in evaporation between sites, years, or even following decreases in pasture biomass after grazing, which is shown on the cake by varying amount of green grated coconut. He demonstrated this lack of difference was because radiation was the major controller of evaporation. This consistent water loss is shown on Jack’s cake by equivalent numbers of water molecules (jelly beans) in the three paddocks of Jack’s cake. The fourth brown paddock portrays a “sprayed-off” paddock prior to pasture renewal and had lower evaporative losses and, of course, fewer jelly beans.
Pronger, J.; Campbell, D.I.; Clearwater, M.J.; Rutledge, S.; Wall, M.J.; Schipper, L.A. (2016) Low spatial and inter-annual variability in evaporation from a year round intensively grazed temperate pasture system. Agriculture Ecosystems and Environment. 232:46-58.
Pathogen removal in a denitrifying bioreactor
Femke had paper accepted in the Journal of Environmental Quality where she demonstrated rapid pathogen removal from treated wastewater as it passed through a denitrifying bioreactor (about 20 m long). The inlet is on the left with two sampling ports (blue) and further sampling points along the length of the bed and one at the outlet. The green icing represents sedges growing on top which is pealed back to show the wood chips (nuts). The poster in the background celebrates her success in winning a prize for giving an oral presentation of her work.
But wait, there’s more! Femke is getting married in Nepal soon and the two dolls represent are her and Ilias (her hubby-to-be). Safe travels!
Rambags, F.; Tanner, C.C.; Stott, R.; Schipper, L.A. (2016) Fecal bacteria, bacteriophage, and nutrient reductions in a full-scale denitrifying woodchip bioreactor. Journal of Environmental Quality. 45:847-854. doi:10.2134/jeq2015.06.0326
Landslides and recovery
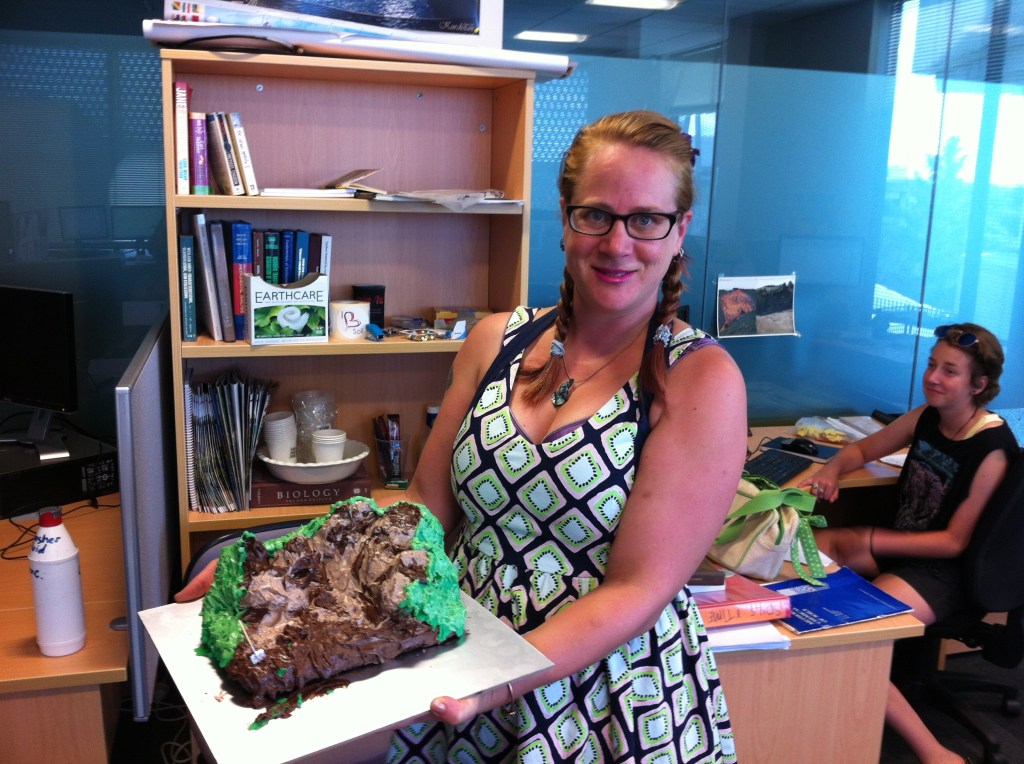
Adrea’s MSc Thesis examined the rate of soil recovery on four landslip zones (shear, intact accumulation, transition and re-deposition) with adjacent control zone to represent soil pre-landsliding. She concluded that differences between landslide zones were greater than differences between landslides of varying ages for C, N, and P. Her multi-layer cake represents one of the many landslides she sampled.
Persian dessert to finish off pizza lunch
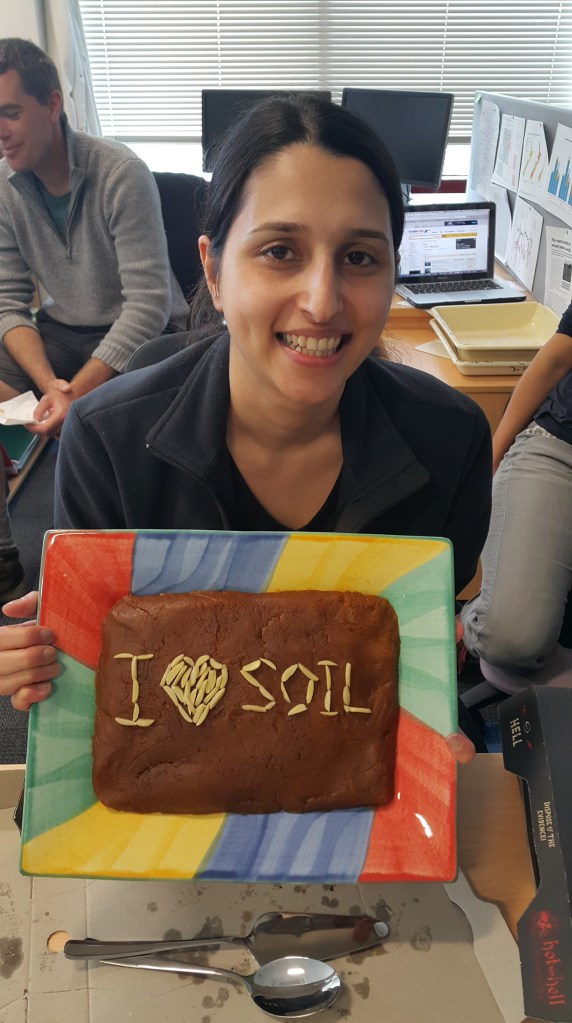
Mahdiyeh Salmanzadeh brought in a Persian dessert called Halva which include flour, sugar, saffron and rose water made by her mother who is visiting. This was an excellent sweet for our end-of-semester celebration pizza lunch.
Doreen celebrates her PhD thesis submission
Doreen recently submitted her PhD thesis in which she studied carbon and DNA preservation in buried allophanic soils and paleosols on Holocene tephras in New Zealand. Allophane in such soils can encapsulate organic matter and DNA and the once-surface horizons became increasingly divorced from the modern organic carbon cycle with time because of the ongoing tephra deposition. Buried deep in the layers of her cake are red allophanic spheres with sorbed organic matter and DNA. On one of her sampling sites where existing vegetation is mainly European grasses, Doreen isolated DNA fragments of New Zealand native trees from the 2.2 m-depth horizon (c. 5500 to 9400 years old).
Urine spotting cake
Olivia Jordan (a former Masters student at Waiber) has recently been working as a casual research assistant at AgResearch. Work has included considerable amounts of urine spotting and leachate collections with associated lab processing. Upon leaving AgR for a position at DairyNZ she thought she would make a urine spotting cake! Both sheep and cows are represented as are little yellow patches, not so easy to see in the field.
Olivia will be working as a Assistant Research Technician at DairyNZ, they will be lucky to have baking skills!
Carbon balance of a dairy farm
Susanna Rutledge published a paper that looked at the carbon balance of a dairy grazed pasture at Scott Farm over four years. Depicted on the cake is the average carbon inputs and outputs in units of jellybeans (jb), where 1 jb = 200 kgC/ha.y. Inputs (right side) include imported feed, effluent and the net of carbon dioxide exchange. Outputs include milk export, silage and methane. The balance (3 jelly beans) is assumed stored in soil.
S. Rutledge, P.L. Mudge, D.I. Campbell, S.L. Woodward, J.P. Goodrich, A. M. Wall, M.U.F. Kirschbaum, L.A. Schipper, 2015. Carbon balance of an intensively grazed temperate dairy pasture over four years. Agriculture, Ecosystems and Environment, 206, 10-20
Celebrating Soil
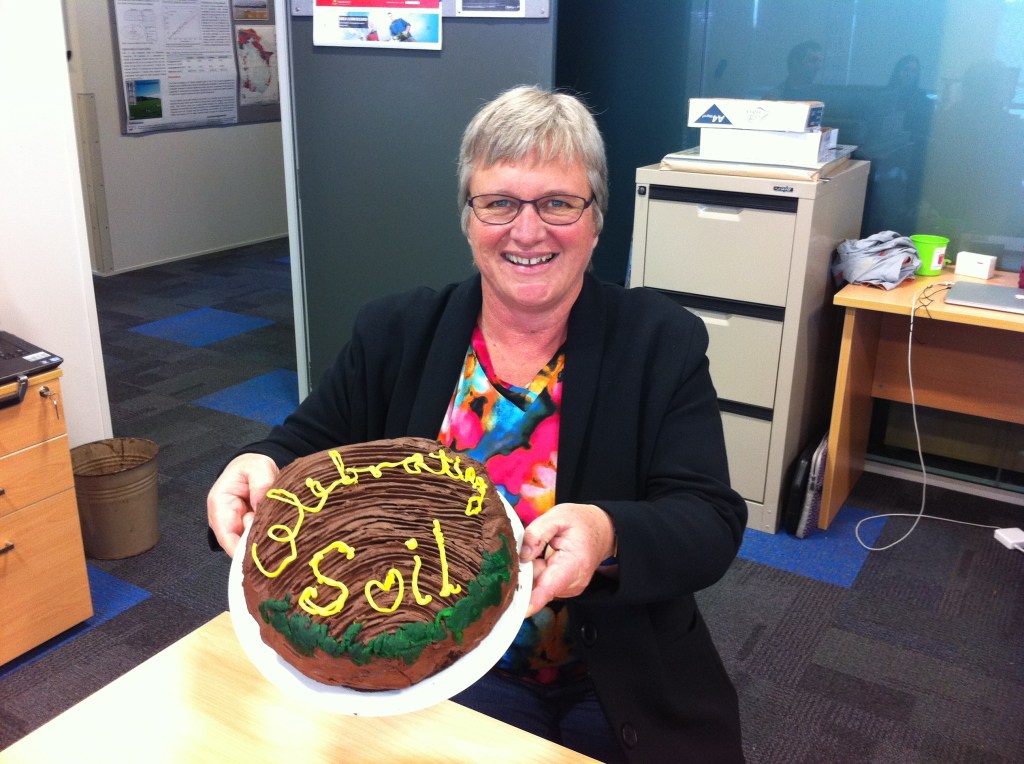
Megan Balks, with co-author Prof Darlene Zabowski of University of Washington and support from graphic designer Marianne Coleman, recently got her book, provisionally titled “Celebrating Soil” submitted to Springer Publishers. The richly-illustrated, popular science book celebrates the soils and landscapes on Earth, ranging from the Arctic to the Antarctic.
Increased roots below diverse pasture
Sam McNally (PhD candidate) had his first paper accepted which compared root biomass of ryegrass/clover and more diverse pastures (including plantain, chicory, and lucerne). He found greater root biomass in the more diverse pastures which also had deeper rooting. The hypothesis is then posed that this greater biomass will increase carbon inputs and potentially storage in soil.
On Sam’s cake, the diverse pasture is on the left and you can see greater rooting depth and biomass down the side. Lego man is taking cores on either side of the wooden fence.
McNally, S.R.; Laughlin, D.C.; Rutledge, S.; Dodd, M.B.; Six, J.; Schipper, L.A. (2015) Root carbon inputs under moderately diverse sward and conventional ryegrass-clover pasture: implications for soil carbon sequestration. Plant and Soil. 392: 289-299.
Pasture Pulling
Emma finished her MSc thesis which attempted to determine reasons for pasture pulling. Pulling occurs when animals grazing on pastures and pull the whole plant out of the ground rather than only removing leaf material. Emma attributed pulling to limited rooting depth, low root density in the 5-10 cm depth, increased compaction with depth, less cohesive soil when it has low moisture, and the incidence of pasture growing in clumps. Emma made cup cakes with little pasture clumps – these were completely grazed.
Root stocks in pasture swards
Olivia finished her MSc thesis which looked at seasonal changes in root biomass in 14 pasture sward mixes (3 replicates each). 2,500(!) cores (taken to 60 cm) later, the observed root biomass ranged from 1100-24000 kg DM ha-1 across the different mixtures. From seasonal sampling, total carbon input to soil ranged from 700 to 1300 kg C ha-1 y-1. Olivia’s cake displays soil cores laid out with topsoil at left and gleyed soil horizons to right. In the end, Olivia sampled and washed more than a m-3 of soil.
Global soil 15N measurement

Louis contributed to a paper synthesising global distribution of soil 15N led by Joe Craine (Kansas State University). The paper hypothesised new reasons for spatial variation in 15N of soils focusing on the extent to which organic matter has been decomposed. Louis’ cake depicts the sampling sites around the world – New Zealand was nearly completely hidden due to high sampling density.
Patterned ground in Antarctica
Megan Balks and her former student Josh Scarrow published a new paper: Scarrow, J.W., Balks, M.R., Almond, P.C. (2014) Three soil chronosequences in recessional glacial deposits near the polar plateau, in the Central Transantarctic Mountains, Antarctica. Antarctic Science. 26: Pages 573-583.
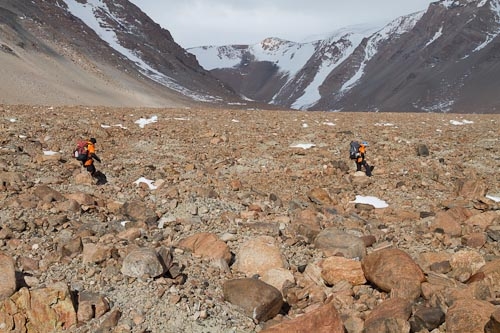
Megan brought us a cake that provides a delicious example of bouldery desert pavement and patterned ground in Antarctica that forms in deposits of rocks, gravel and sand previously entrained in an advancing glacier. As the glacier melts and retreats the rocks remain on the permafrost surface. Pictured are the cake (the underlying permafrost is represented as frozen cheesecake) and adjacent is a photo of the real thing!
Iranian dessert
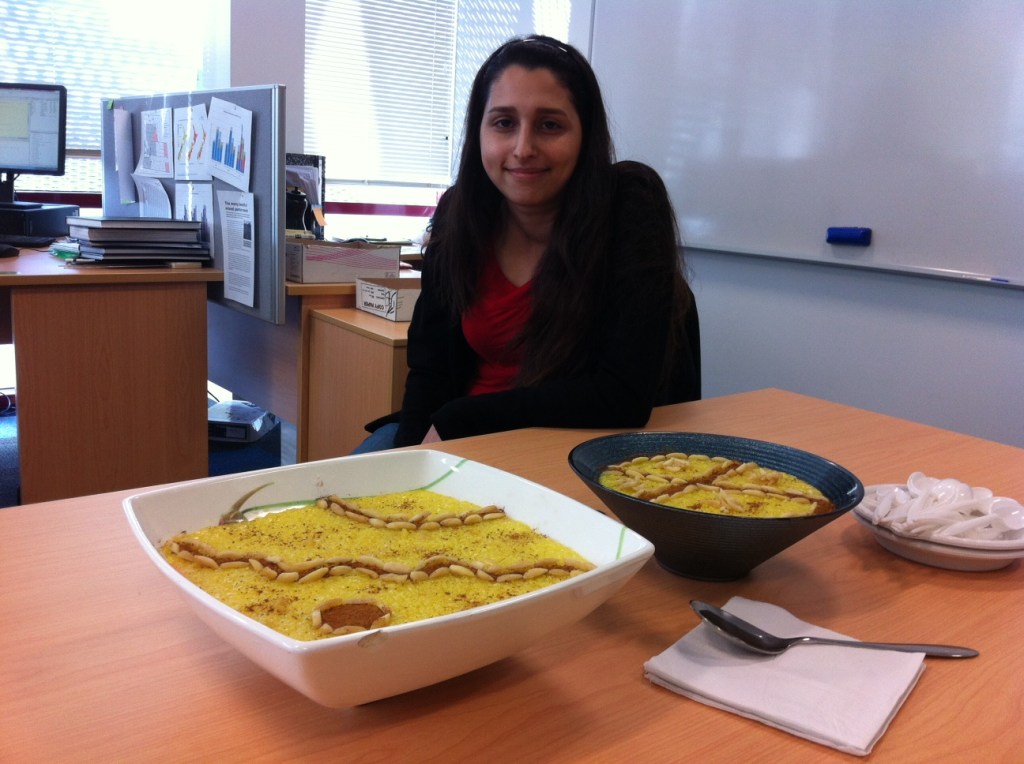
Mahdiyeh Salmanzadeh had her PhD enrollment confirmed and so treated us to an Persian dessert called “Sholeh Zard”. A rice pudding with a really different, lovely flavour of saffron and rose water, topped with cinnamon and almond.
Improved soil carbon measurements
Tim Norris recently submitted his MSc thesis where he tested a new approach for determining the effects of land use on soil carbon stocks. Tim sampled 24 adjacent drystock and dairy farms using a new coring approach. Not only was the method able to detect smaller differences between land uses but was about 2-3 times faster (and easier) than traditional pit sampling. His cake (note: this is the first cake he has ever made!) shows dairy and drystock farms, blue squares on either side of the fence represent sampling plots. The dairy farm is slightly lower than the drystock site because of soil compaction under dairy. If you zoom in, you can also see a deep-burrowing earthworm sweet.
DNA binds to soil
Doreen brought us a cake to celebrate publication of her recent book chapter which looked at how DNA binds to allophanic clays as part of her investigation into finding ancient DNA in buried tephras.
Huang, Y-T.; Lowe, D.J.; Churchman, G.J.; Schipper, L.; Rawlence, N.J.; Cooper, A. (2014) Carbon storage and DNA adsorption in allophanic soils and paleosols. In: Hartemink, A.E.; McSweeney, K. (eds). “Soil Carbon”. Progress in Soil Science Series, Springer, New York, pp. 163-172.
Temperature response of biology
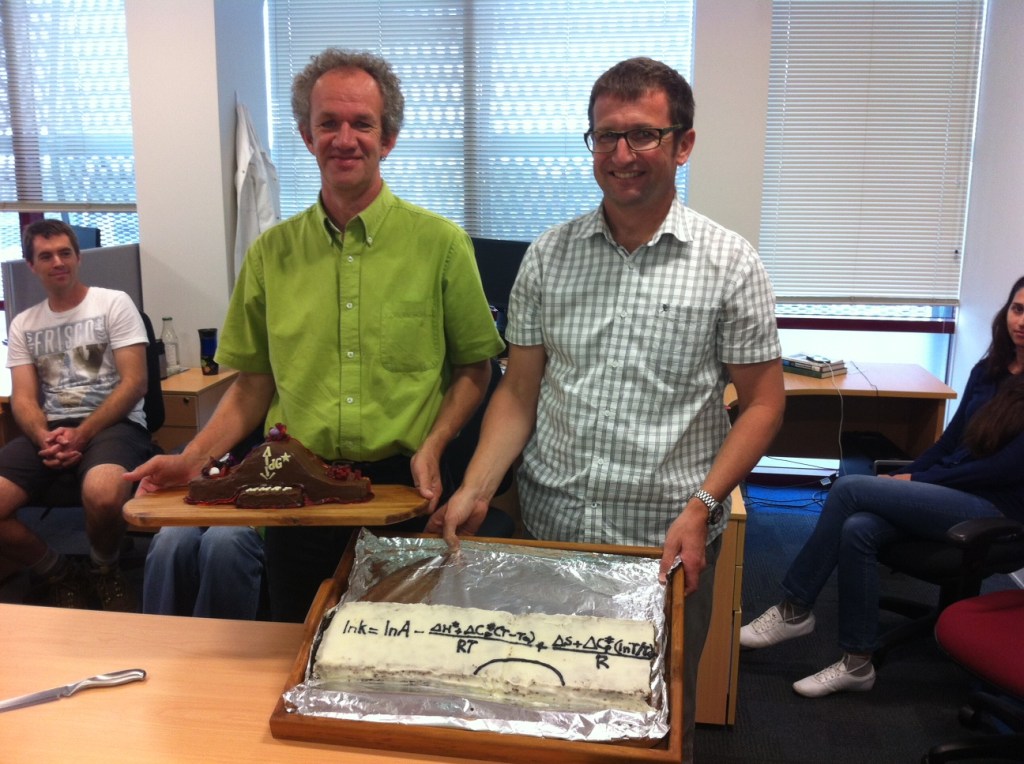
New paper with our colleagues in the Molecular Biology lab led by Vic Arcus and so two cakes were needed. New paper with our colleagues in the Molecular Biology lab led by Vic Arcus and so two cakes were needed. Vic’s cake, made by his daughter Grace, has the newly modified Arrhenius equation (macro-molecular rate theory – MMRT) that takes into account changes in heat capacity of enzyme-catalysed reactions. This equation predicts a temperature optimum for biological reactions. Louis’ cake depicts changes in Gibbs free energy during a model reaction where a mint is split into two gummy bears.
Schipper, L.A.; Hobbs, J.K.; Rutledge S.; Arcus, V.L. (2014) Thermodynamic theory explains the temperature optima of soil microbial processes and high Q10 values at low temperatures. Global Change Biology. 20, 3578–3586. DOI: 10.1111/gcb.12596.
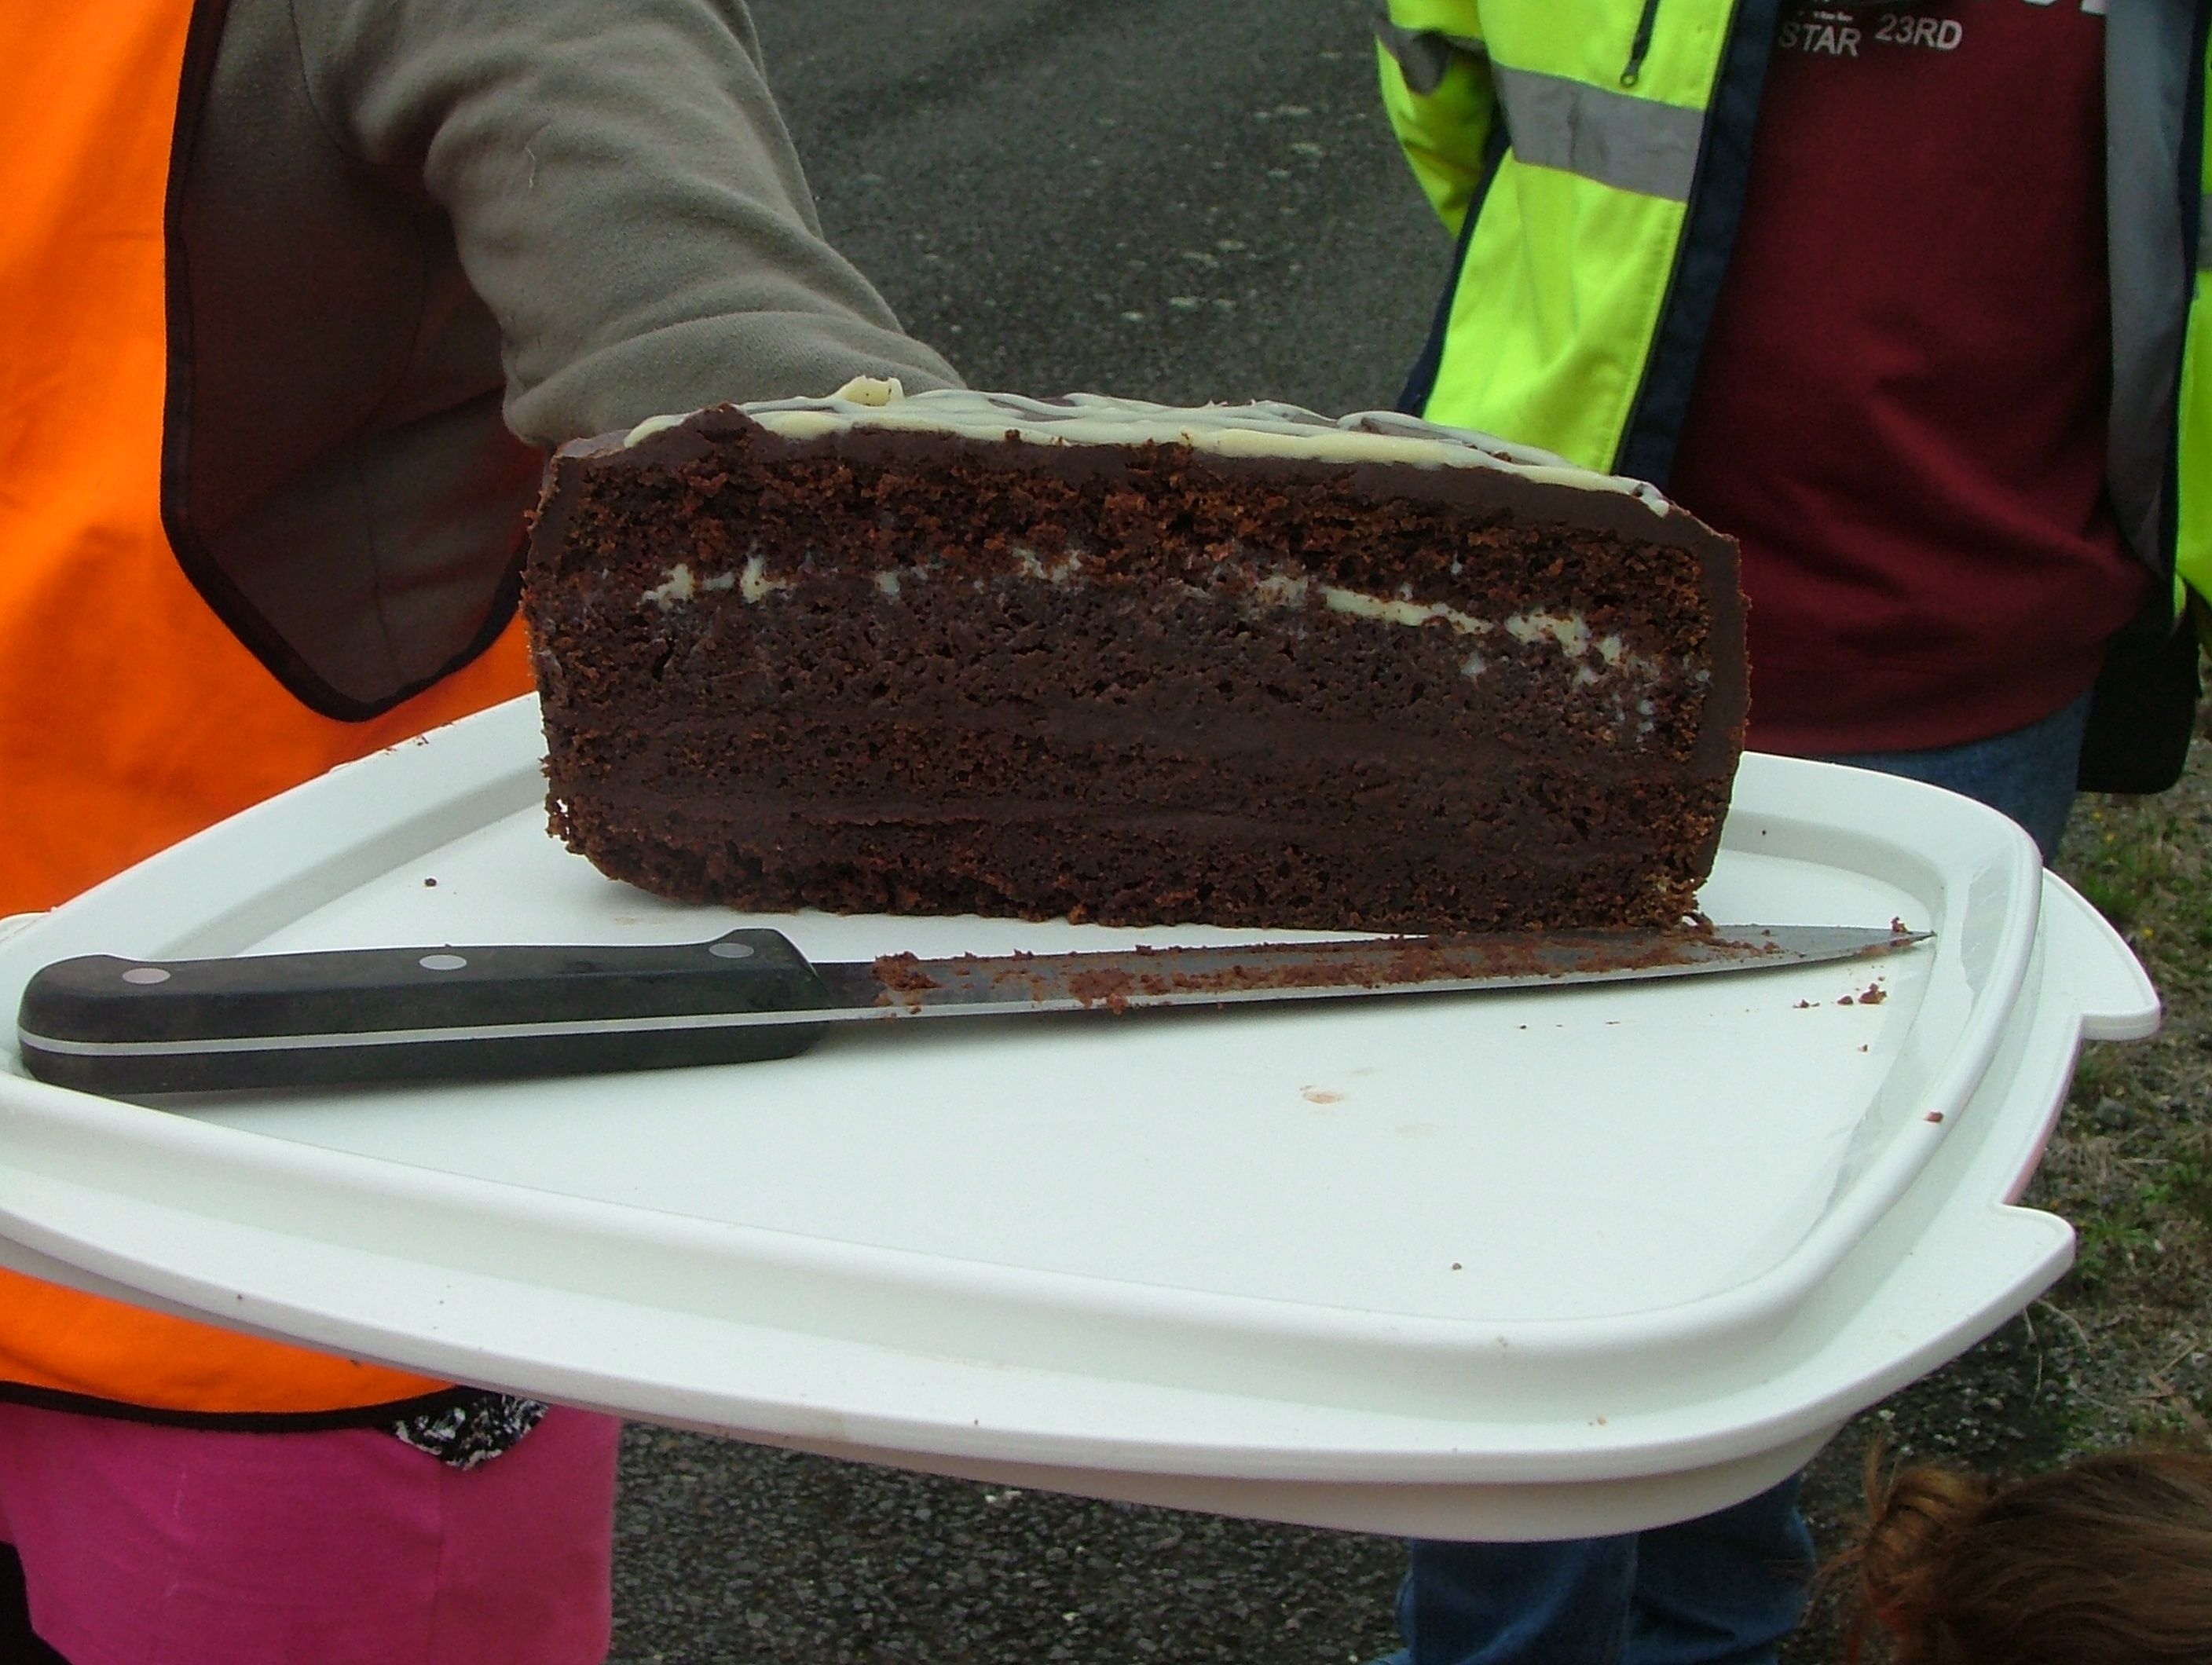
700 years young
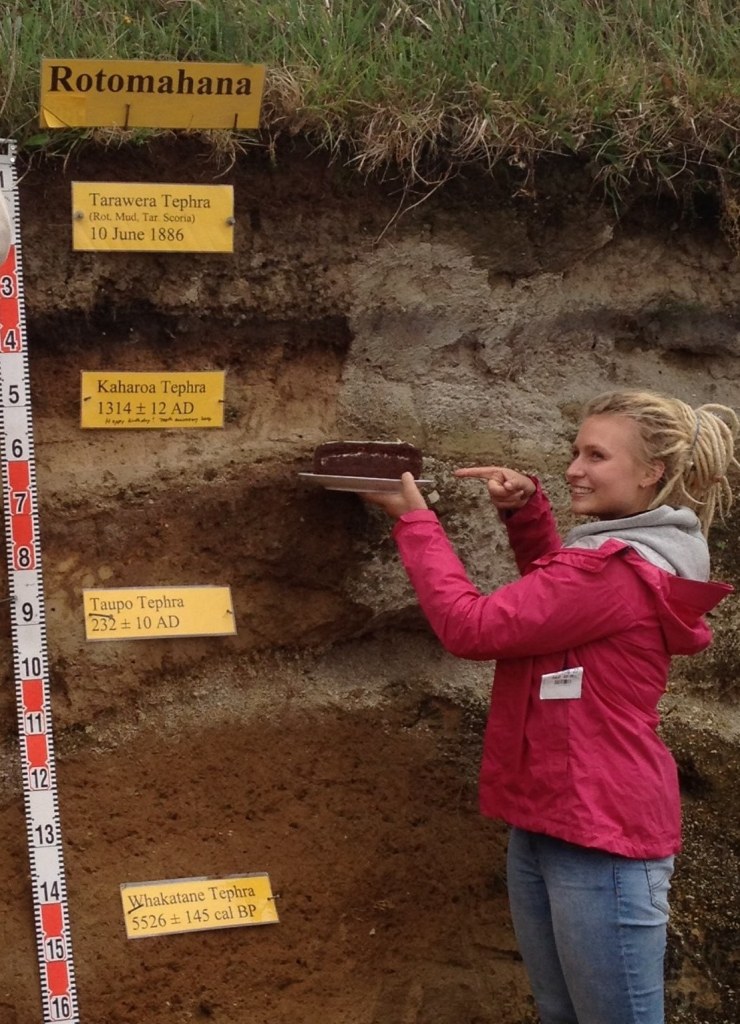
David Lowe led a third year soil science fieldtrip to a tephra section and brought a cake with him for morning tea. This year is the septingentenary cake birthday of the Kaharoa (700 years young). Anna has lined up the tephra layers in the cake and the section.
Peat decline in Waikato
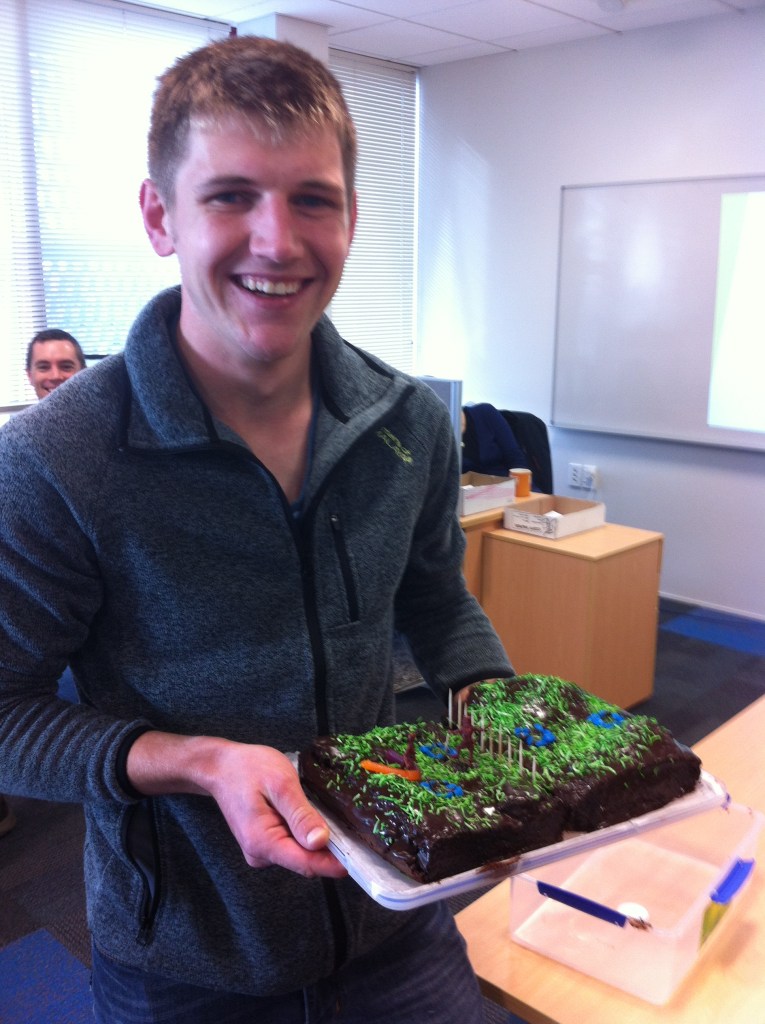
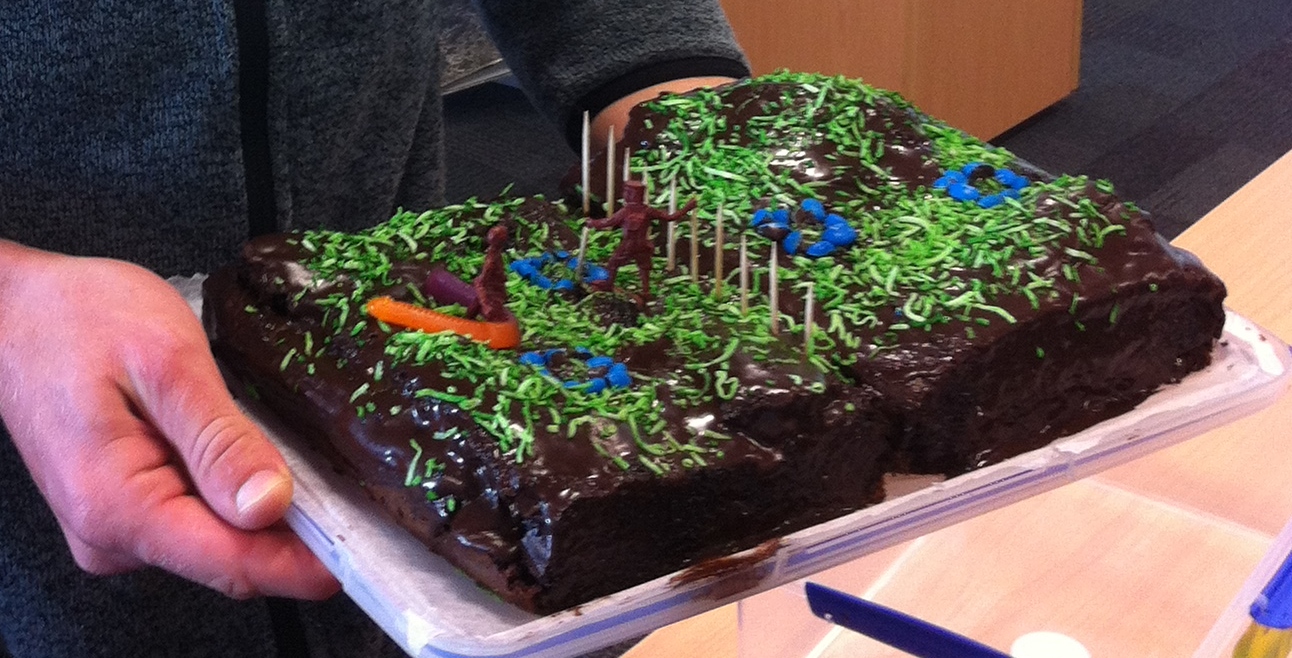
Jack Pronger had a paper accepted in the Journal of Environmental Quality that determined rates of peat subsidence under agriculture in the Waikato. The cake depicts the different landuses: dairy, blueberries, cropping for maize and a remnant restiad peat bog (dark green). Jack used a peat probe to find the bottom of the profile and the little lego man is holding one. Notice also that the remnant bog and blueberries site have slightly higher surface elevation while the maize cropping has a lower elevation. This demonstrates how different land uses are likely to alter subsidence rates.
Pronger, J.; Schipper, L.A.; Hill, R.; Campbell D.I.; McLeod, M. (2014) Subsidence rates of drained agricultural peatlands in New Zealand and the relationship with time since drainage. Journal of Environmental Quality. 43: 1442-1449
Carbon balance of a peat bog
Dave Campbell brought in a cake of a study conducted at Moanatuatua which looked at annual carbon budgets. Featuring a eddy covariance tower, footprint analysis, solar panels, wind turbine and adjacent forest.
Campbell, D.I.; Smith J.; Goodrich, J.P.; Wall, A.; Schipper L.A. (2014) Year-round growing conditions explains large CO2 sink strength in a New Zealand raised peat bog. Agricultural and Forest Meteorology. 192-193:59-68.
50th birthday and education
Surprise birthday (50th!) research cake for Louis from Angela – summarising some of his contributions to soil science education.
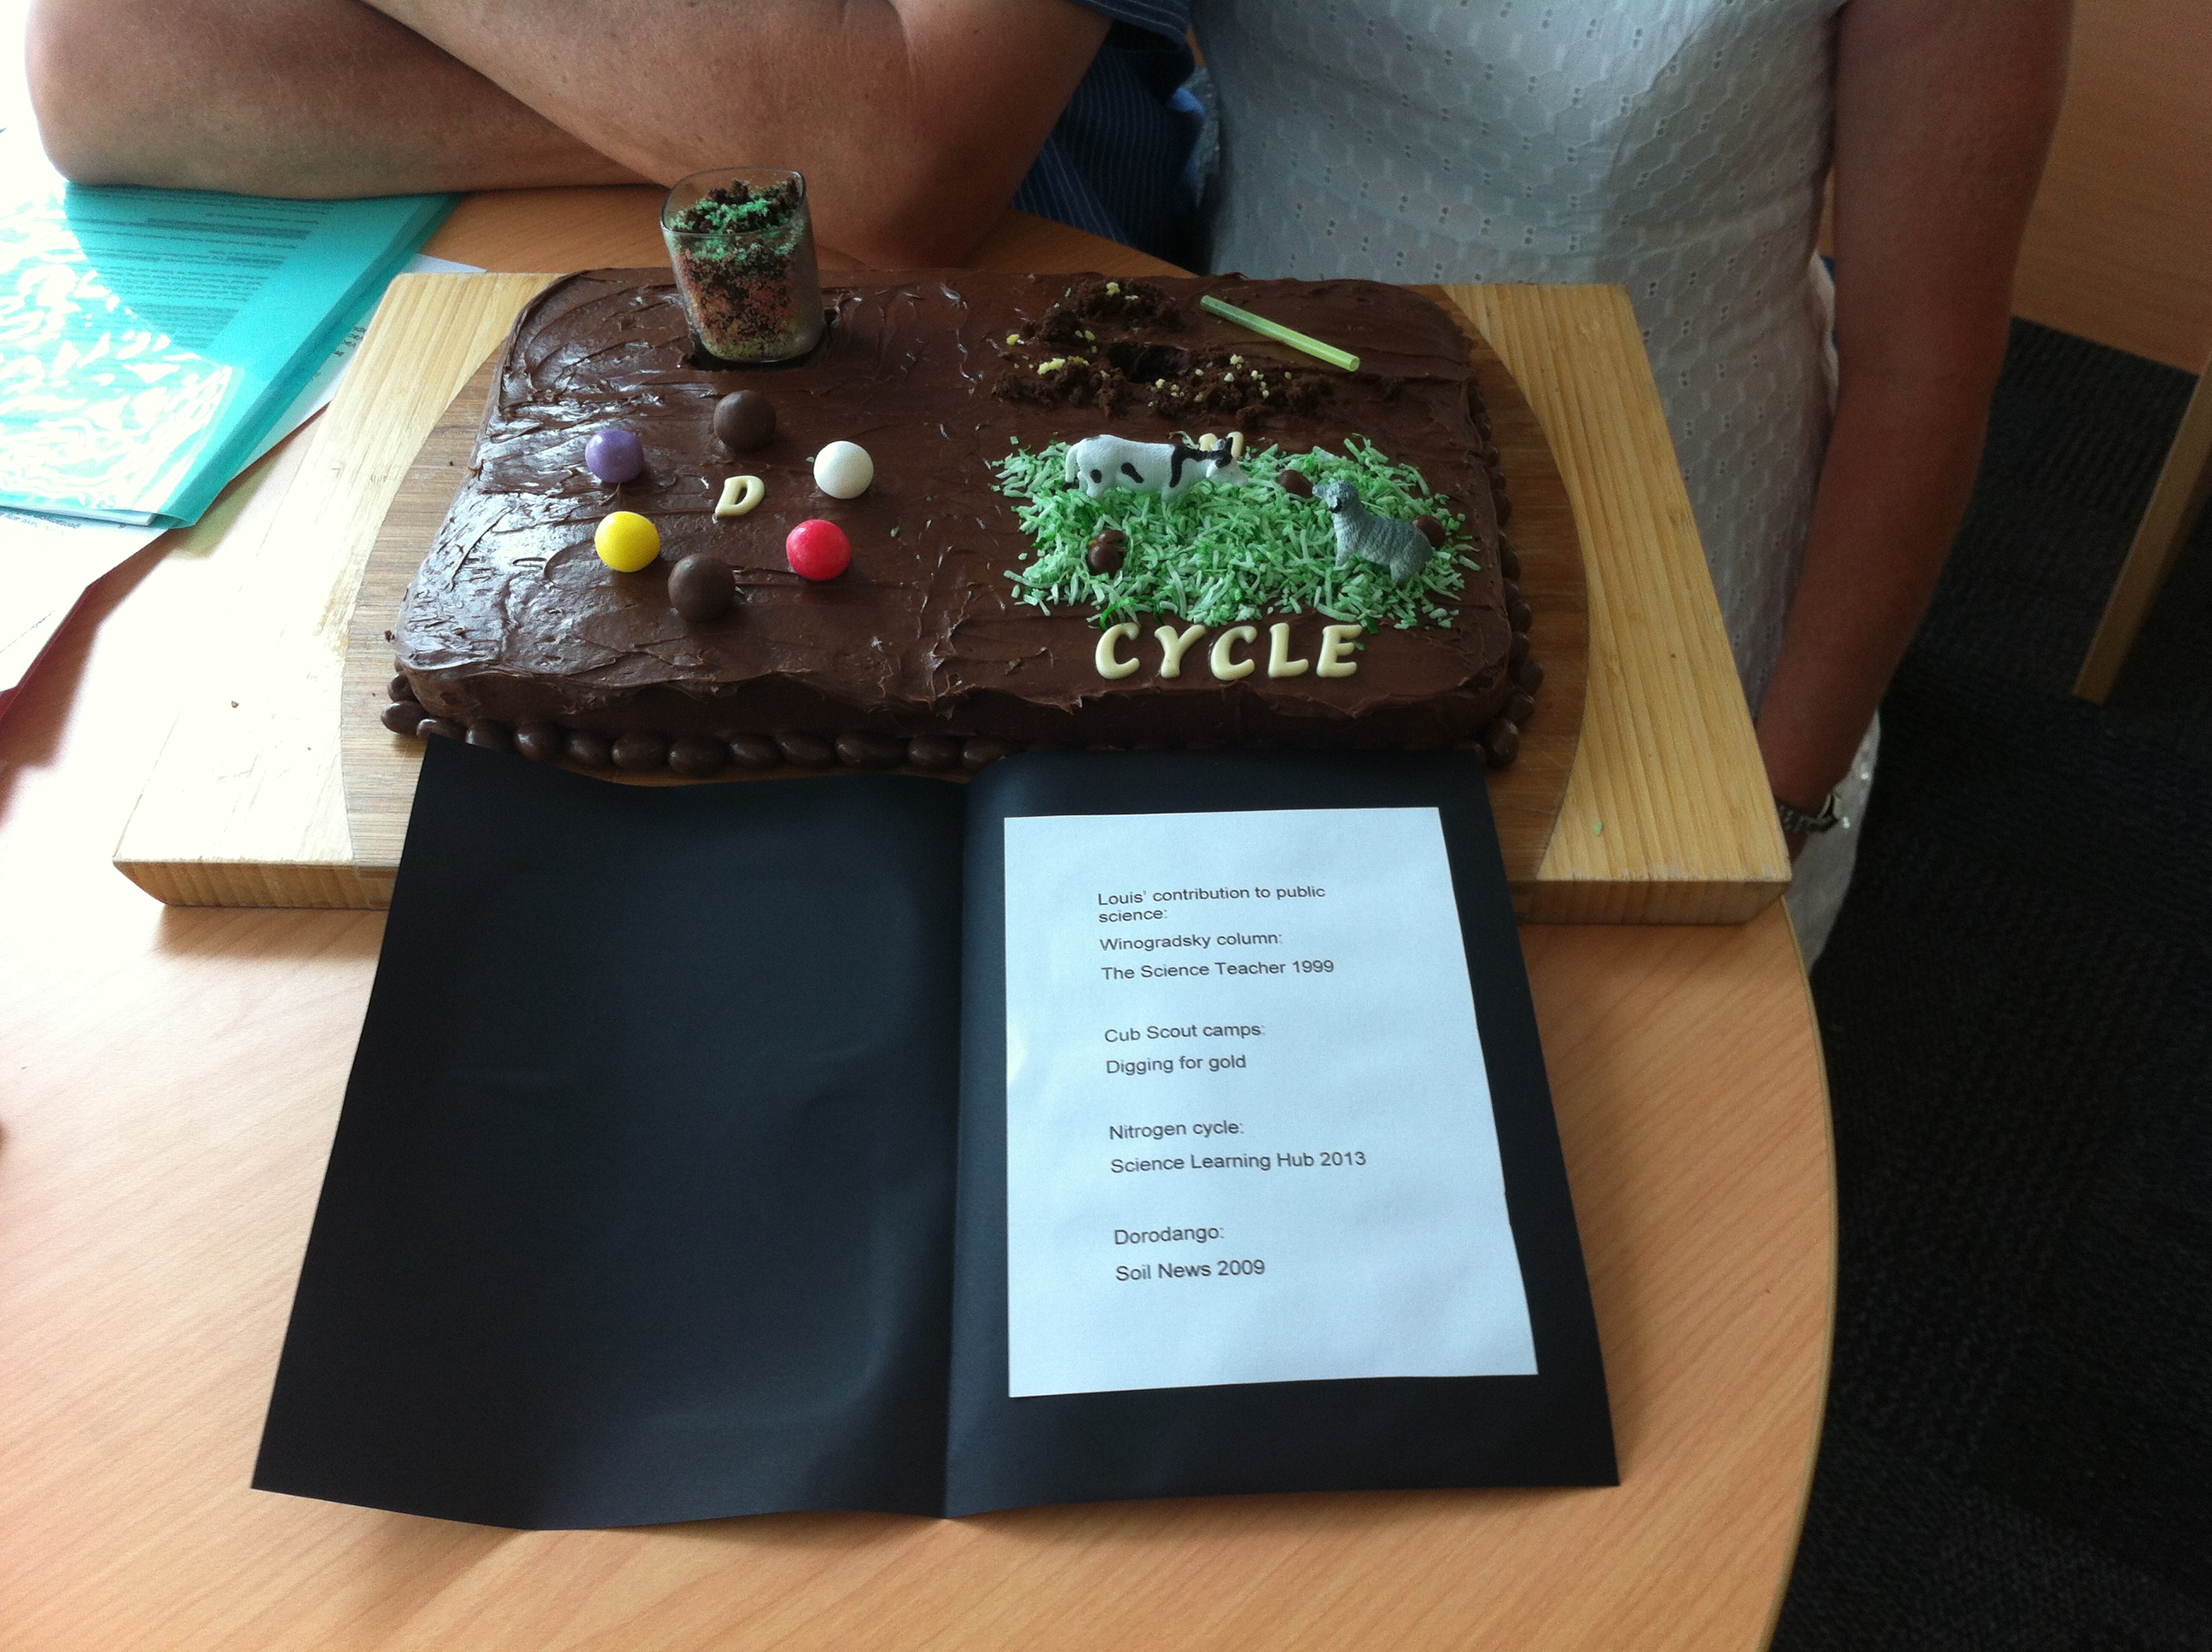
LICOR cake

Courtney Ruffell and Staci Boyte worked with us over the summer break on controls of CO2 production from soils and litter. They made this banana cake. Staci examined temperature controls of soil respiration and Courtney investigated photodegradation of plant litter in restiad bogs. The cake is a infrared gas analyser which both of them used to conduct their experiments. In the background is the real analyser
Paired site sampling and carbon stocks

Alice Barnett measured carbon and nitrogen stocks in 25 paired dairy and drystock sites and demonstrated dairy farms have less carbon than drystock in the topsoil. The cake shows the soil pits dug on either side of the fence with M&Ms on the bottom for annoying stones. The paper was published so Louis made a cake. Barnett, A.L.; Schipper, L.A.; Taylor, A.; Balks, M.R.; Mudge P.L. (2014) Soil C and N contents in a paired survey of dairy and dry stock pastures in New Zealand. Agriculture Ecosystems and Environment. 185: 34– 40.
A beginning in research cakes
Alex and Anna have created a cake of their research projects. On the left, an eddy covariance tower and board walk on a peat bog where Alex’s MSc project is looking at canopy contribution to CO2 flux. On the right, Anna’s MSc project examining temperature sensitivity of nitrate removal in denitrification beds complete with sampling wells. In the background, Nadia looks amused, but probably wants to eat cake.
Note that the ideas/descriptions/opinions on these pages are ours and may not reflect those of the University of Waikato.
